
I got my hands on this very cool Titanic dataset that provides me with a list of passengers and a bunch of information about them, like their names, ages, ticket fares and classes, where they got on, and how many siblings, parents, and children they came with. I’m really interested in trying to figure out if I can discern patterns in who survived and who didn’t– but first I have to sort out what sort of data I really have. Typically distinguishing data types is covered in a research methods course, but this post aims to introduce some of the standard ways of talking about data.
What are we actually looking at?
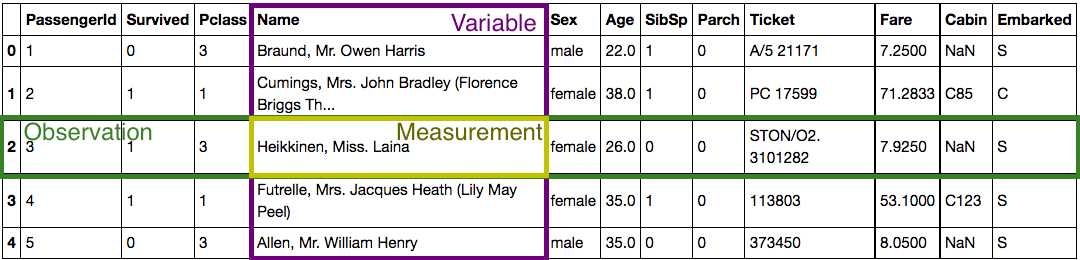
- Dataset: collection of related information (such as records of passengers on the titanic)
- Variable: attribute of the dataset (passenger’s name or passenger’s sex)
- Observation: entry in the dataset (a single passenger record, including info such as name, sex, and fare)
- Measurement: single data point (eg: one passenger’s name)
Independent & Dependent Variables
Although being able to categorize data as independent or dependent is often taken for granted, this distinction is crucial for any later analysis. This boils down to: given a set of data, are they related to each other in a way where one value affects the other?
Independent
These measurements don’t affect each other. For example, the age of one passenger has nothing to do with the age of a different passenger, and neither of those values affect the ages of the other passengers, so age is independent with respect to itself. Age is also independent of ticket number since there’s no relationship between a passenger’s age and their assigned ticket number.
Dependent
These measurements do affect each other. The passenger ids were assigned by whoever was encoding the data, but done so in an ordered fashion such that every passenger id is one more than the previous one. So the first id has a value of 1 and the second has a value of 2 and so every passenger id is one more than the previous; therefore passenger ids are dependent. It is the only dependent variable in the dataset, but there are still dependent relationships between the variables. For example, passenger class is somewhat related to fare.
A less arbitrary and more common example of dependent datasets are time dependent recordings like temperature; today’s temperature is influenced by yesterday’s temperature and will influence tomorrow’s temperature.
Types of Measurements
Data typically falls into one of two categories:
- Quantitative: how much?
- Discrete: countable values (number of siblings, number of children)
- Continuous: any numerical variable with a technically infinite number of increments (age can be 28, 28.1, 28.5…)
- Qualitative: what kind?
- Interviews, Observations, Documents
- Categorical: qualitative data that can be sorted into groups (survived is yes/no, pclass is 1/2/3)
While usually straightforward, categorical data sometimes can masquerade as a quantitative measurement. For example, survival and passenger class are coded numerically (0/1, and 1/2/3 respectively), but could just as easily be represented using words like yes/no and low/middle/high. If the numbers are just there because there are a set number of types of something, meaning that the order of the numbers is arbitrary — like survived and not survived or 3 passenger classes — then it’s categorical data. But if the number is intrinsic to the measurement — describing how many siblings a passenger has or the passenger’s age– then it’s a quantitative measurement.
Measurement Scales
Categorical and quantitative variables are typically measured in the following ways:
- Quantitative:
- Interval: difference between values means something quantifiable (cost difference, age difference)
- Ratio: interval data with a floor (lowest published ticket price, can’t have a negative number of relatives)
- Categorical
- Nominal: names of categories that are mutually exclusive (male/female, survived/not)
- Ordinal: values with a natural ordering like best to worst (pclass-1/2/3)
Nominal categories being mutually exclusive doesn’t mean that categorical data is inherently independent. For example, imagine a map of neighborhoods categorized into safe, so-so, unsafe. It is highly likely that one neighborhood’s classification is dependent on its neighboring zipcode’s classifications.
Want to learn more?
There’s a workshop today, 6:30-8:30 PM, where we’ll discuss how all this information informs the types of ways in which we can visualize data.
Sign up here: https://www.eventbrite.com/e/data-visualization-1-tickets-31587287427
Resources:
- http://regentsprep.org/REgents/math/ALGEBRA/AD1/qualquant.htm
- http://www.usablestats.com/tutorials/basicStats
- http://www.abs.gov.au/websitedbs/a3121120.nsf/home/statistical+language+-+quantitative+and+qualitative+data

This entry is licensed under a Creative Commons Attribution-NonCommercial-ShareAlike 4.0 International license.


