What is GCDI? (Spring 2018 Edition)
Read moreNote that this blog post is revised and updated every semester, typically in early September or February. Links in this post may be outdated. For up to date information, please check the most recent “Welcome to GCDI”/”What is GCDI?”/”GCDI is Here For You!” post. Dear Digital GC, This post...
0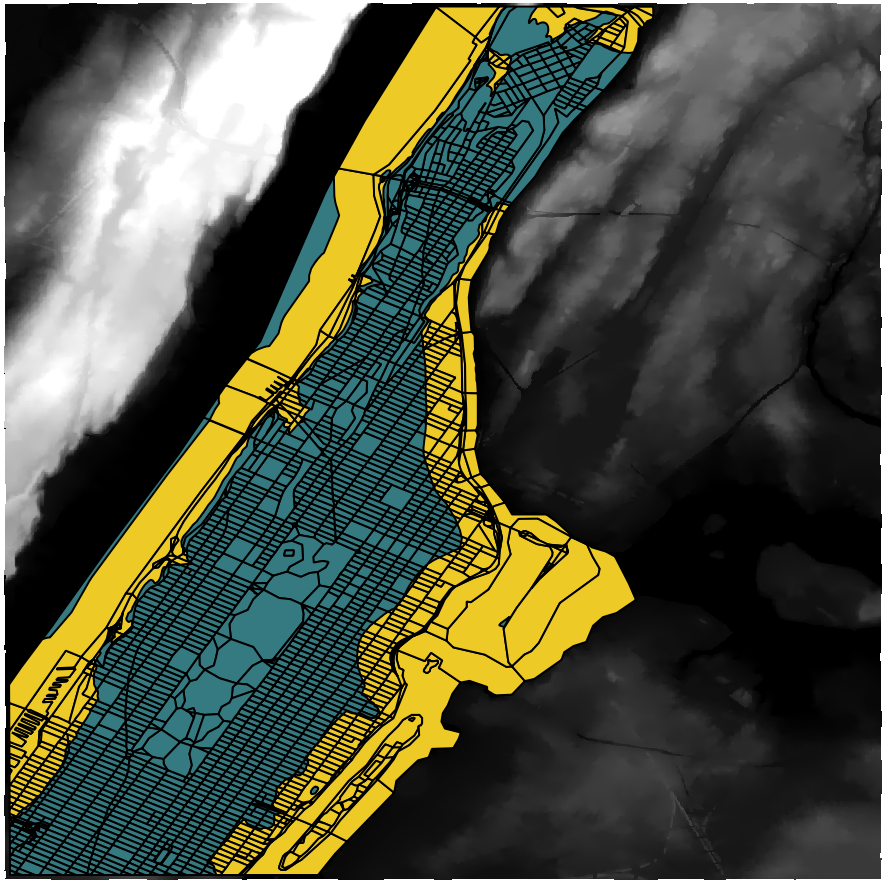
Intro to Mapping using QGIS
Read moreGeographic Information Systems (GIS) are an essential digital tool for the creation and analysis of maps and geographic data, as it offers a wide array of analysis possibilities to scholars who are interested in the geospatial elements of their research projects. This post will guide you through the very basics...
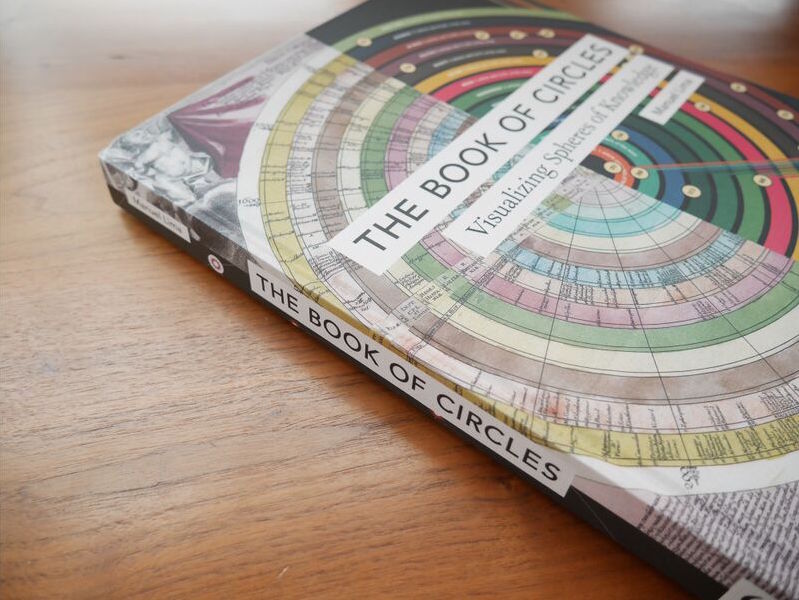
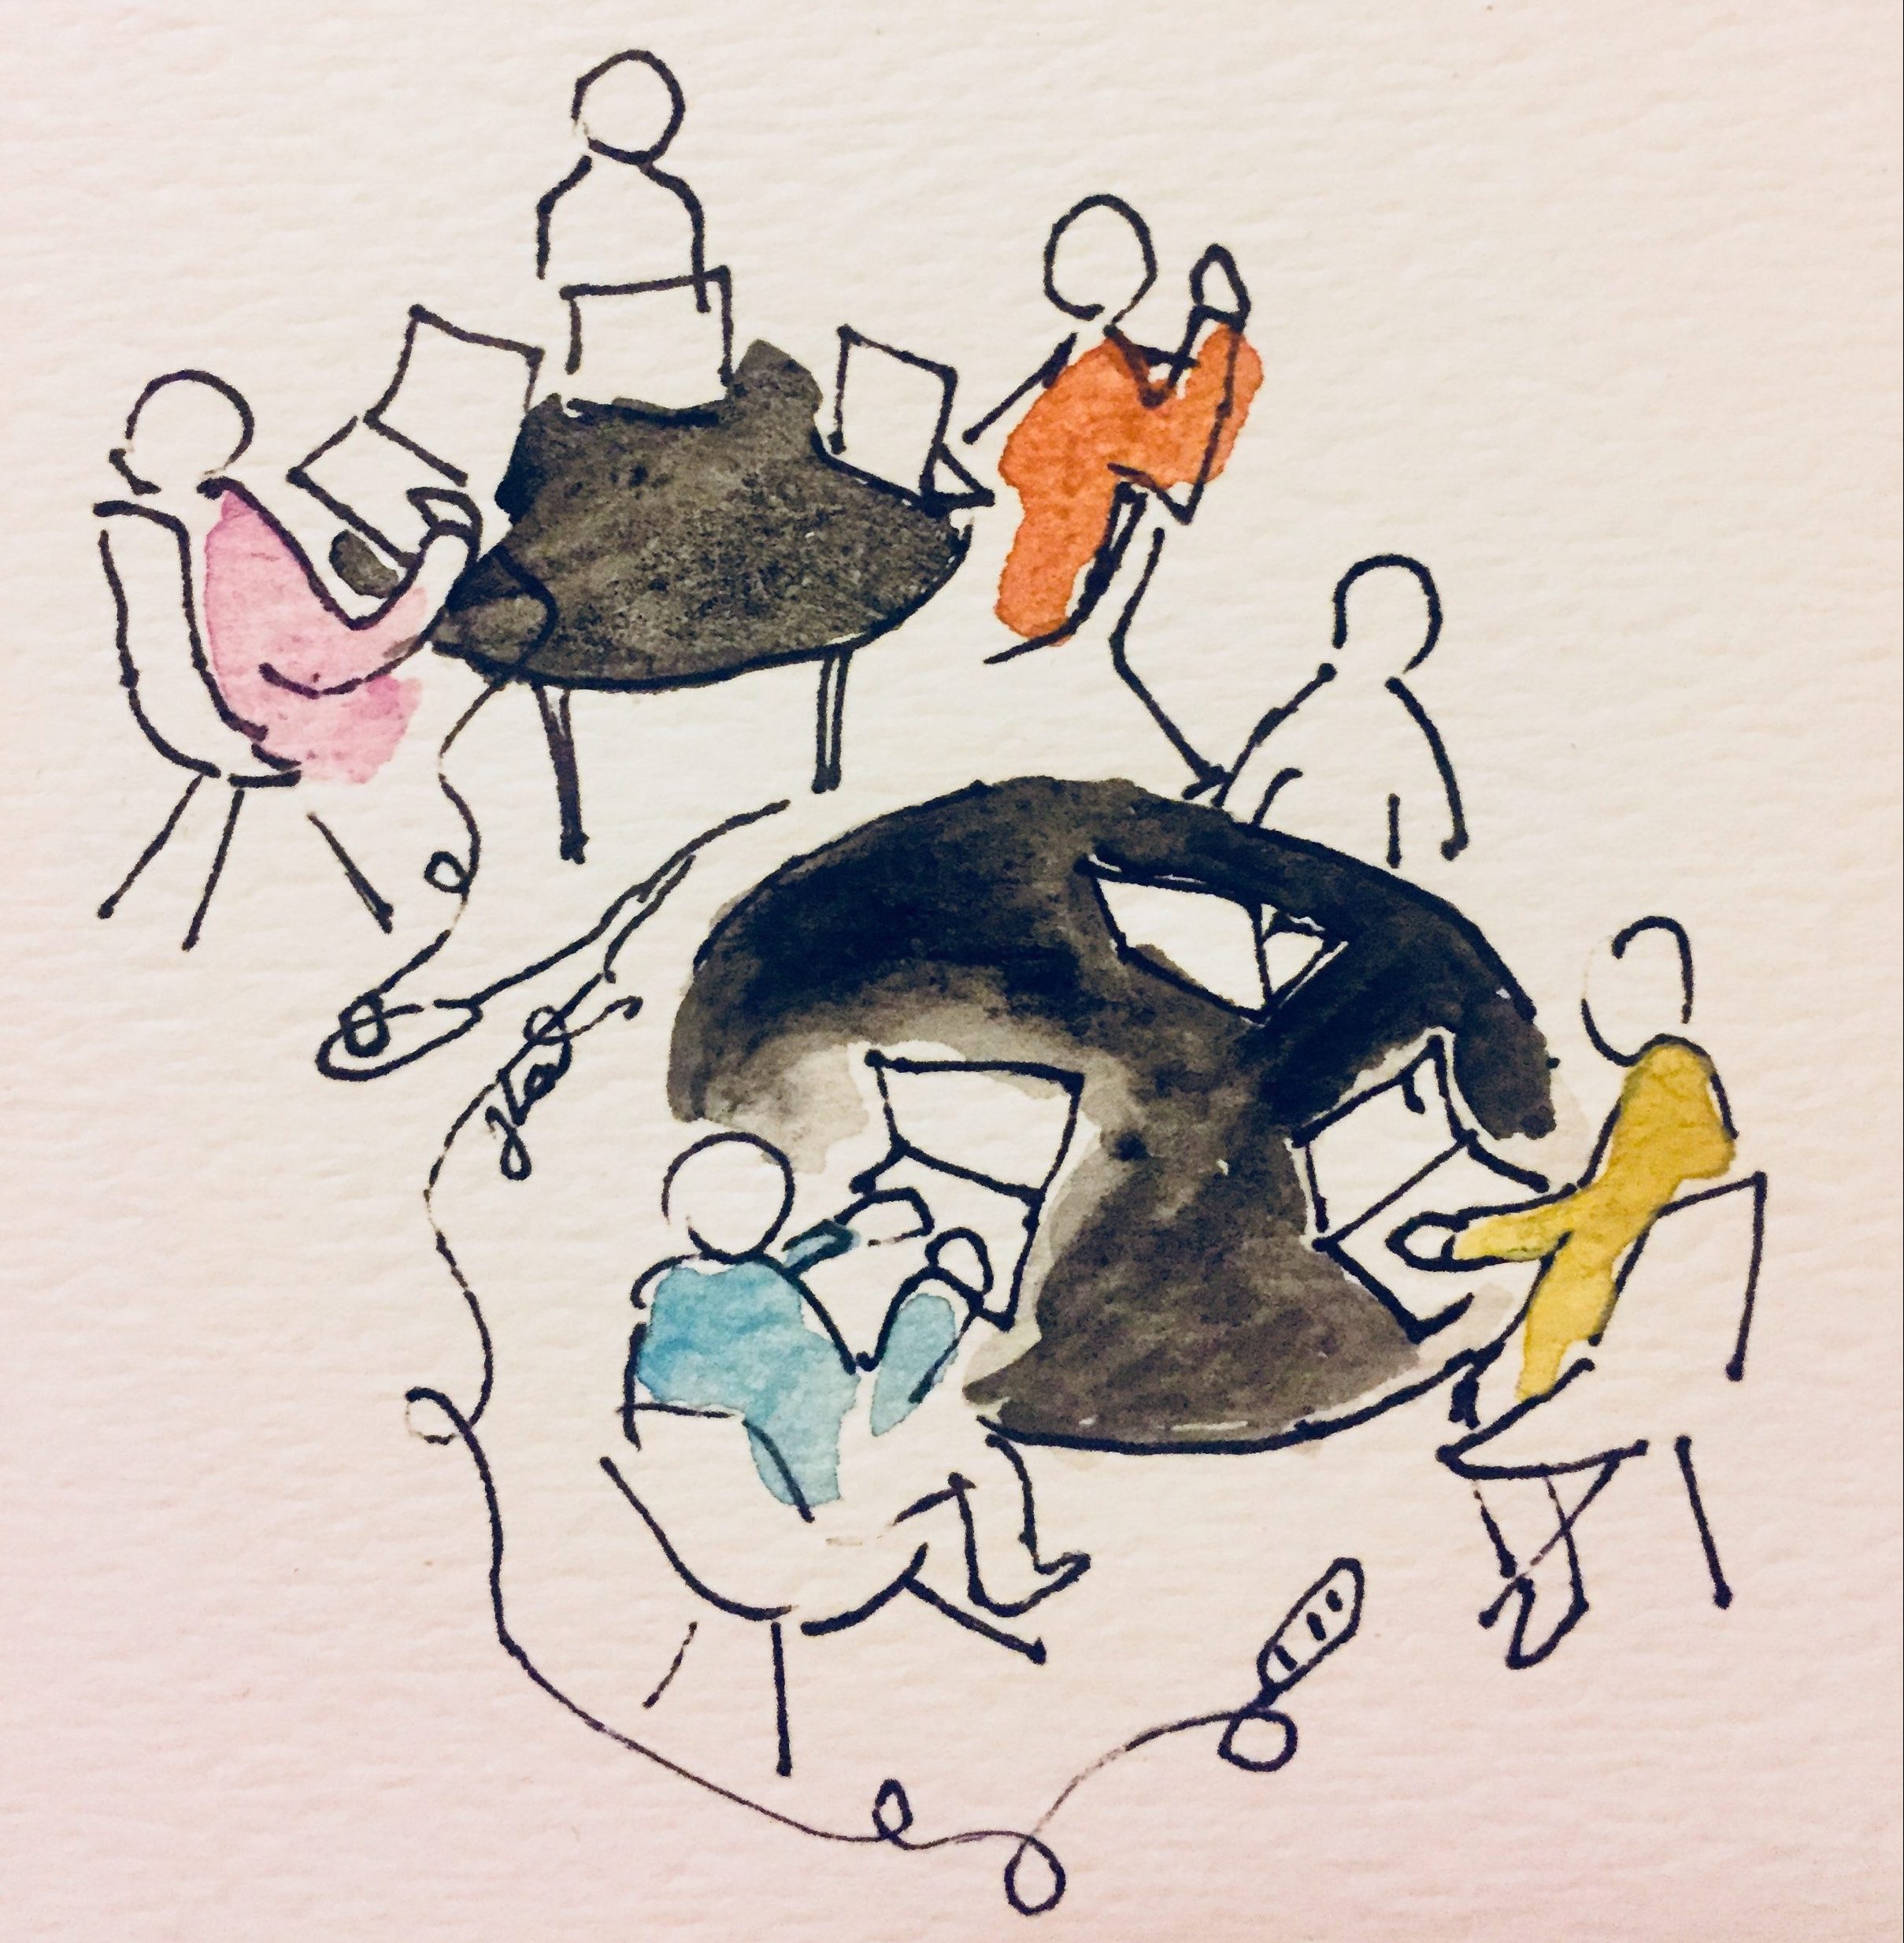
GCDI and Comp Sci Visualization Seminar: The Book of Circles
Read moreTomorrow the Graduate Center Digital Initiatives and the Computer Science department welcome designer, author, lecturer based in NYC, RSA fellow, TED speaker, founder of Visual Complexity, design lead @Google Manuel Lima. He will be discussing The Book of Circles: Visualizing Spheres of Knowledge, a unique compendium of 300+ images...
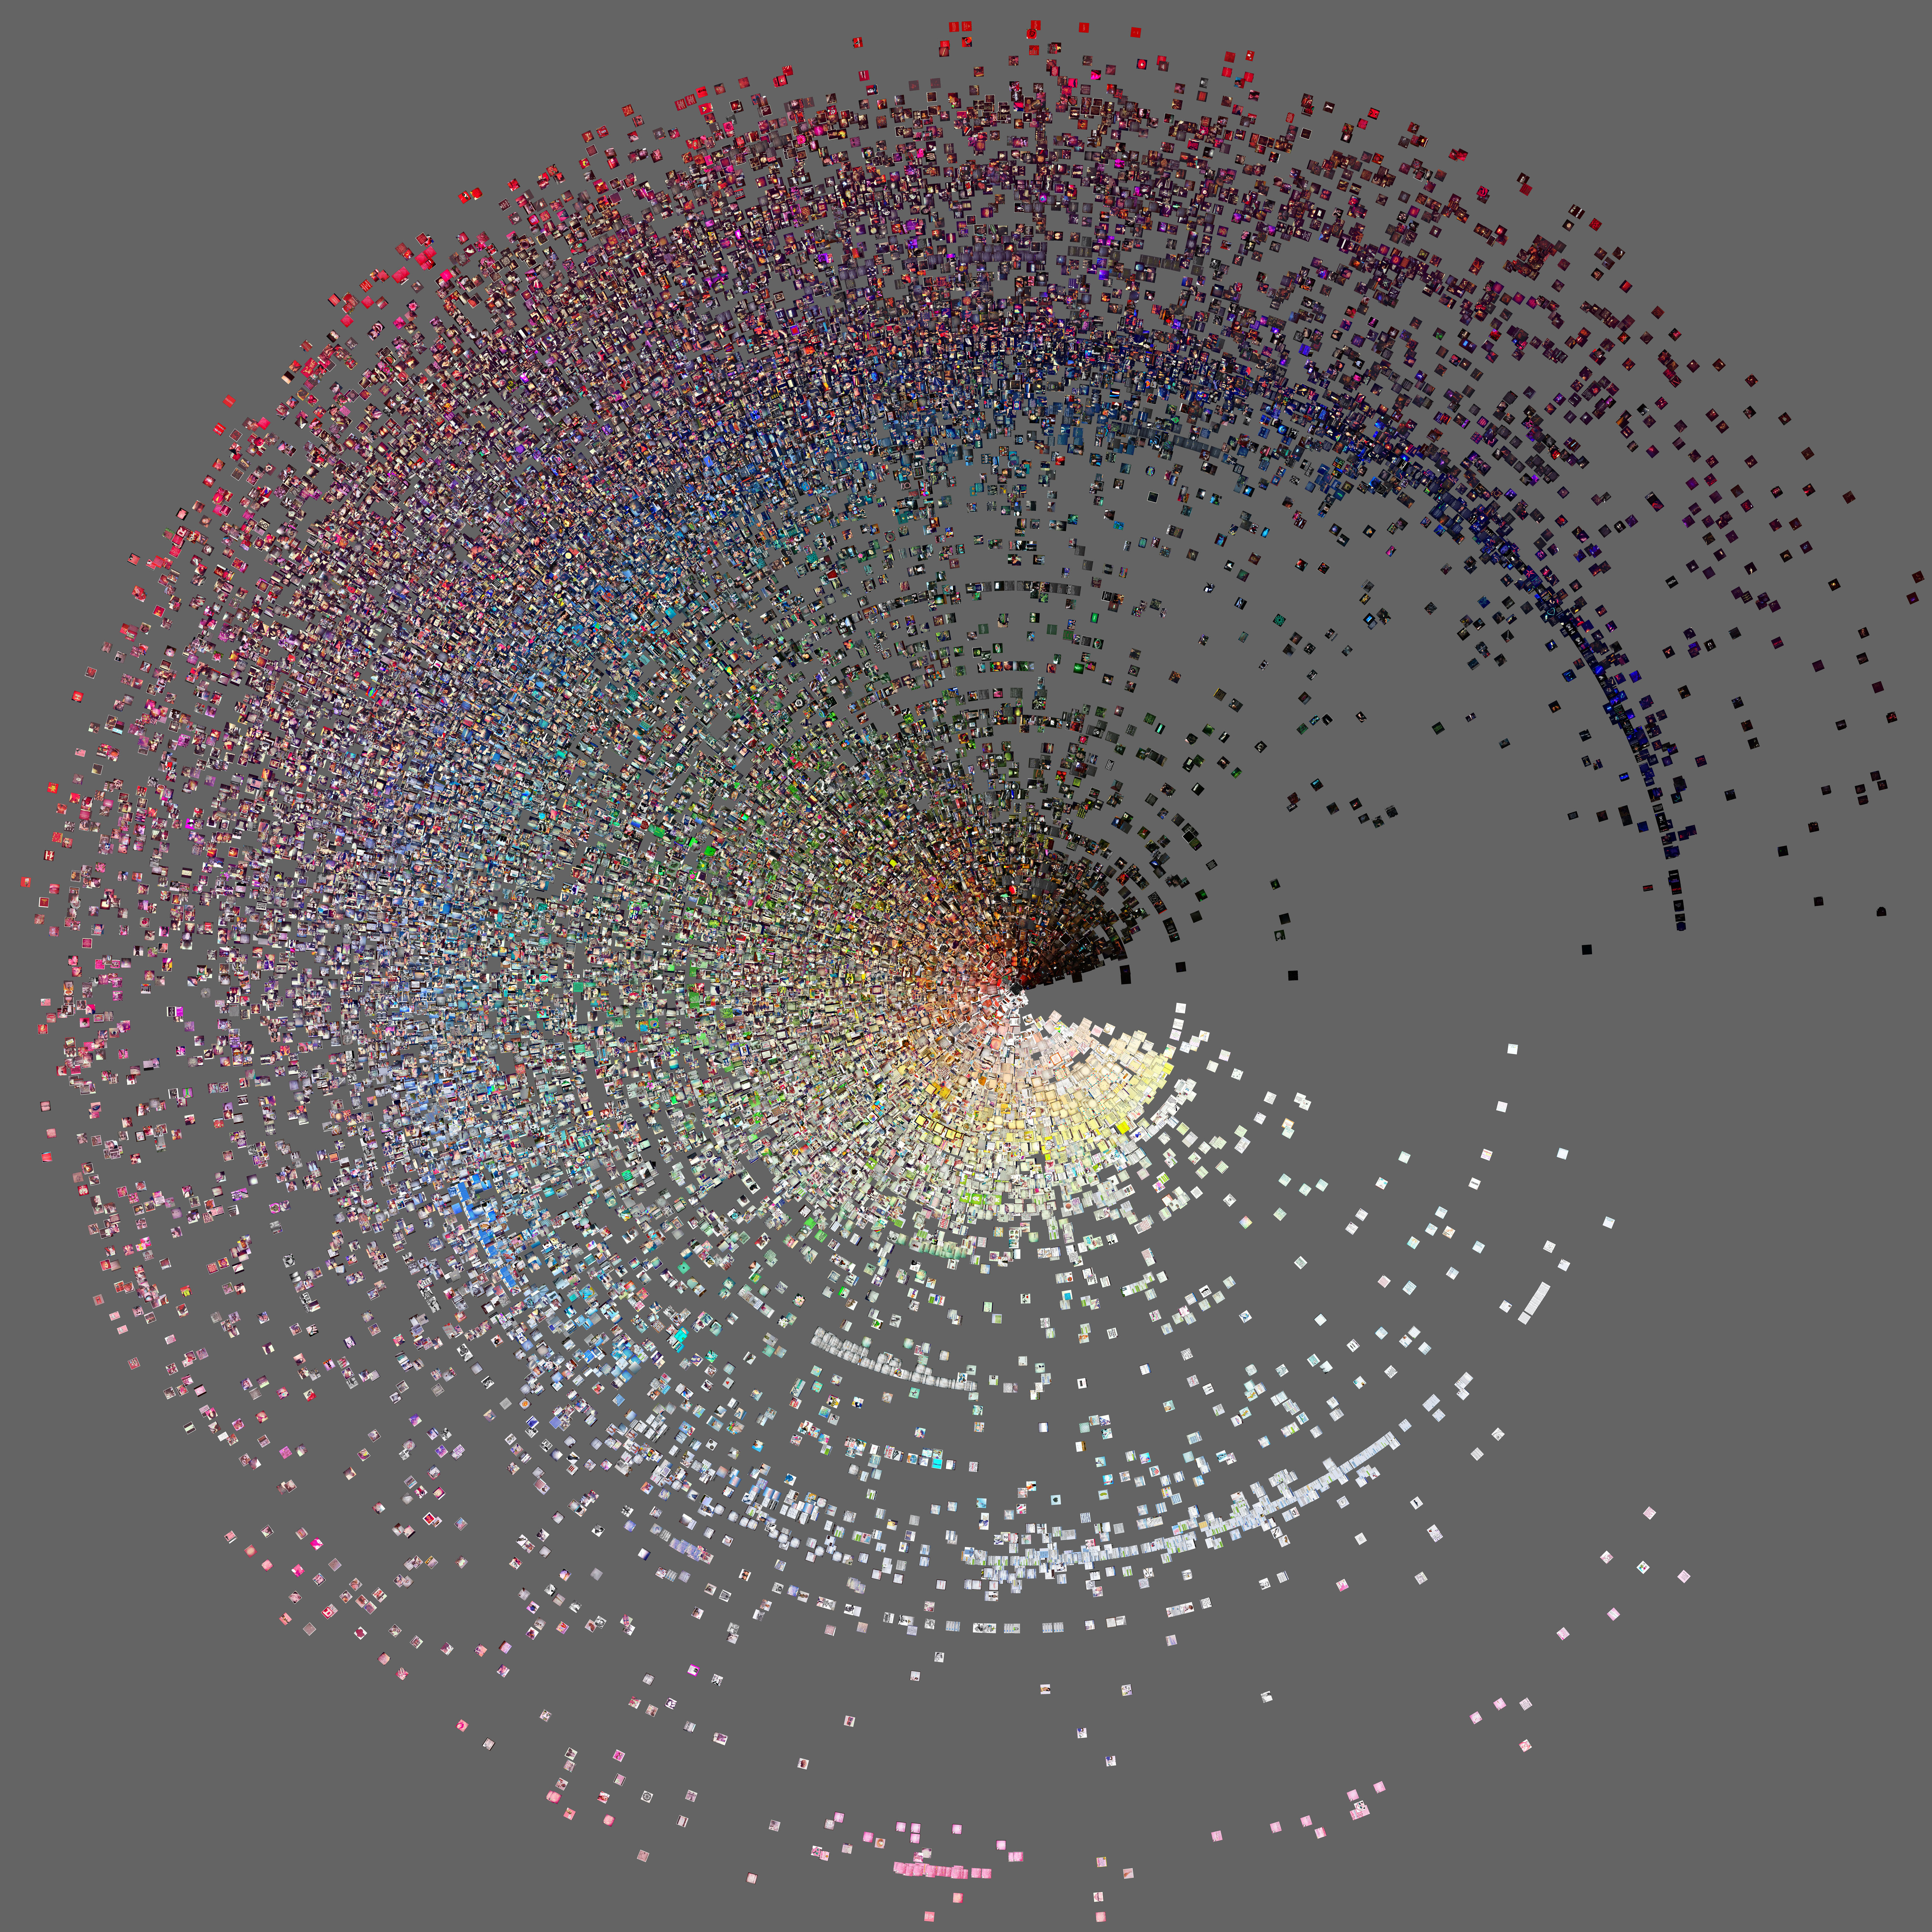
GCDI and Comp Sci Visualization Seminar: How to See 1 Billion Images?
Read moreToday the visualization seminar cohosted by the Computer Science Department and the Graduate Center Digital Initiatives dives deep into the humanities with a talk on visualizing culture by Graduate Center Professor Lev Manovich. He will discuss how the Cultural Analytics Lab combines data visualization, design, machine learning, and statistics...
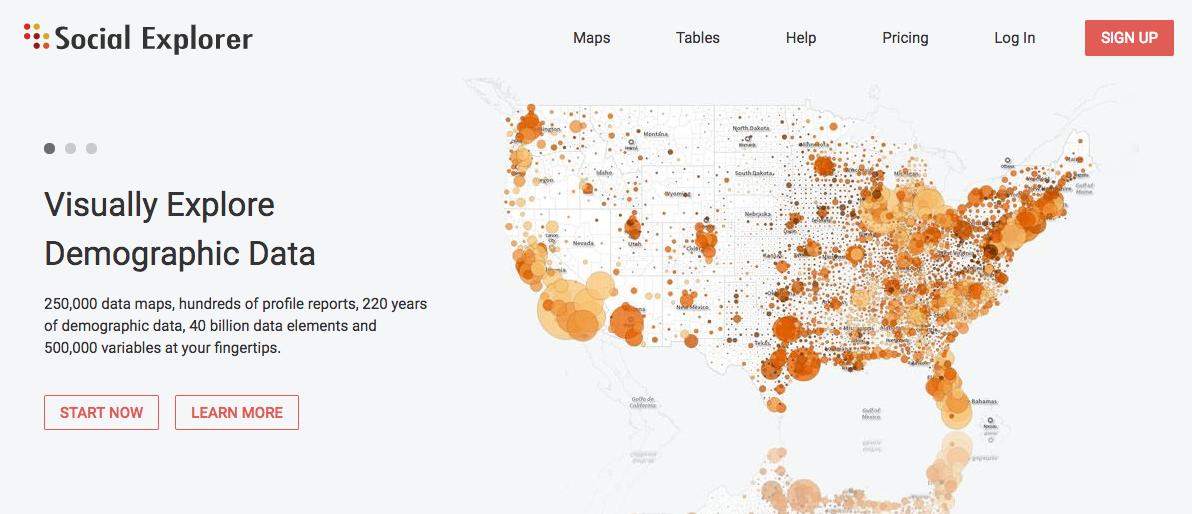
Getting Started with Social Explorer: A GC Resource for Spatializing Demographic Data, Part 1
Read moreNOTE: This post is Part 1 in a two-part series that will help you begin exploring data in a spatialized way using ‘Social Explorer’. Part 2 will show you how you can download & share data tables and maps using this application. Imagine: You are doing research on a...

This entry is licensed under a Creative Commons Attribution-NonCommercial-ShareAlike 4.0 International license.