Introduction
Maps are extremely versatile tools for communicating ideas and information. Creating maps can be challenging, but this tutorial will introduce one tool that simplifies the process of making several types of maps in order to tell your stories.
The tool is called StoryMaps, and it was created by ESRI, the company behind one of the most widely used commercial Geographic Information Systems software tools, ArcGIS. StoryMaps allows users to create maps in order to tell a story around spatialized data, such as photographs, videos, or social information based around specific places.
There are tons of existing examples of StoryMaps that you can check out on the application’s website. They have a searchable gallery as well as curated collections based on predefined categories. One example of what you can do with StoryMaps, which I chose in honor of the recently deceased Harold Ramis, and since I’m currently in New York City, is this particularly fun StoryMap of locations used in the movie Ghostbusters, “Ghostbusters: Something Strange in Your Neighborhood.”
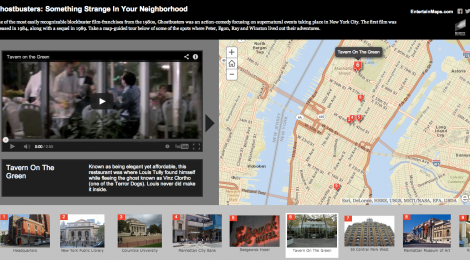
There’s something strange in your neighborhood: a StoryMap tour of the Ghostbusters movie via filming locations in Manhattan
StoryMaps offers several different types of map templates that you can use to tell your own stories, but they roughly fall into two broad categories: point maps and thematic maps. Point maps contain a series of specific locations (e.g., addresses, map coordinates, point markers, etc.), which can be ordered or unordered, and are usually used to point out where specific things are located. Thematic maps contain data about places that are not necessarily tied to specific points on a map (although they can include those as well) but rather, present generalized information about large areas, such as population density within a zip code, or satellite imagery taken in a specific year and light spectrum.
For both of these categories, StoryMaps offers a variety of ways to present the information based on the story you are trying to tell. For example, timelines or tours might use a sequential series of points, whereas a story about urban change over time might use a thematic map with a “slider” that lets viewers seamlessly compare two different thematic maps side by side (you have to see it to get it).
Getting Started
There are pretty well documented tutorials on using the various types of StoryMaps on the ESRI website. What I aim to do here is to help explain what the different options are for creating and displaying your StoryMaps so that you know where to look for help on the ESRI site.
Step 1: Explore
The first thing you should do, if you haven’t already, is to explore some of the StoryMaps on the ESRI website in their searchable gallery and curated collections. This will give you a sense of what’s possible and the different ways of conveying different types of stories and communicating different sorts of ideas.
Step 2: Gather Data
Once you have a sense of the story you want to tell, the next step is to figure out what data you need in order to tell that story.
If you want to tell a story about a collection of points, this might include photographs, videos, news clippings, or simply informational text about specific places.
If your story is one involving one or more themed maps, you want to figure out if maps containing your data already exist. You can search the ArcGIS Online website to see if someone else has already created a map appropriate to your story. Or you can create your own basemaps using the ArcGIS online tools or desktop application (although these methods are beyond the scope of this guide).
To help you build your data collections, you might consider using the ESRI Collector smartphone application, which lets you capture all sorts of data (pictures, video, routes, etc.) along with geospatial information such as where the picture was taken, so that you can build up your StoryMaps data automatically. I’m not trying to turn this into a full blown ad for ESRI tools, but it’s actually a pretty nifty application that integrates easily with their map making software.
Step 3: Decide on a Map Type (Application)
If you looked around the StoryMaps gallery, you noticed that there are several different types of maps that you can build. Each of these particular applications of the StoryMaps platform has a slightly different process for building your map, and might have different constraints on how you actually get the map displayed for people to view. Specifically, there are tools on the StoryMaps website that allow you to build and host map tours, “swipe” maps, and “spyglass” maps, but to create other types of maps you will need to manually edit data files and host them on an external server.
StoryMaps Hosted Maps
StoryMaps hosted maps can be built in a matter of minutes with online tools. These maps can be viewed on the StoryMaps website without any further setup. The downside is that you are extremely limited in the types of maps you can create. The big big big upside is that they are super easy to set up.
Self-Hosted Maps
Self-hosted maps are self-contained “web applications” consisting of database files, or the data; and application files, or the stuff that tells a browser how to display the map. The big upsides here is there is a ton of flexibility to customize your maps to display your data in whatever fashion you want. You can use one of the provided templates as a scaffolding upon which you can add functionality, pizzaz, and flair. You can also use the templates as ready-to-go maps that only require you to add your data and maybe to change a couple of other options to give it your own titles, descriptions, colors, etc. The big downside is that there is a slight learning curve to get started, and an even steeper one to major customizations. It also requires a minimal knowledge of web hosting and, of course, access to a web server.
Step 4: Play
Try all of the different StoryMaps builder tools. Play around with other people’s maps hosted on the StoryMaps website. See what works for you, what is confusing, and what is downright silly. Then use this knowledge to help you create a more effective map. If the purpose of a StoryMap is to communicate ideas, then one of the most important considerations should be how to communicate those ideas clearly. Maybe you’ll stumble onto a map that uses one of the StoryMap applications in a way that you hadn’t considered. Maybe your story is really best told through some variable that doesn’t necessarily fit into maps, but that is still communicable through spatialized data. Don’t be afraid to start over when your first map seems awkward or clunky. As long as you keep your underlying data, creating a new map shouldn’t be too difficult.
Conclusion
StoryMaps provides a variety of options for creating your own maps. They offer a pretty big step up in functionality over some other tools such as custom Google Maps, and are better suited to communicating a range of ideas than Google Maps, which are more appropriate for the simple display of points or areas on a map. Getting started using StoryMaps is easy if you already have an idea in mind—you just need to start gathering data and can immediately begin mapping using one of the StoryMaps builder tools. Alternatively, if you just like the idea of creating your own maps (maybe you recently came across the counter cartographies collective?), but aren’t quite sure what you want to map, browsing the StoryMaps galleries might give you some inspiration. With your idea and some data, all that remains is building the map. I encourage everyone to try playing with the map builder tools. It’s free and really simple to get started. But if you are down for the challenge, I strongly encourage you to also try developing your own web application using one of the StoryMaps templates since they offer a great deal of additional flexibility in how you tell the geographic stories that are meaningful (or simply useful) to you.