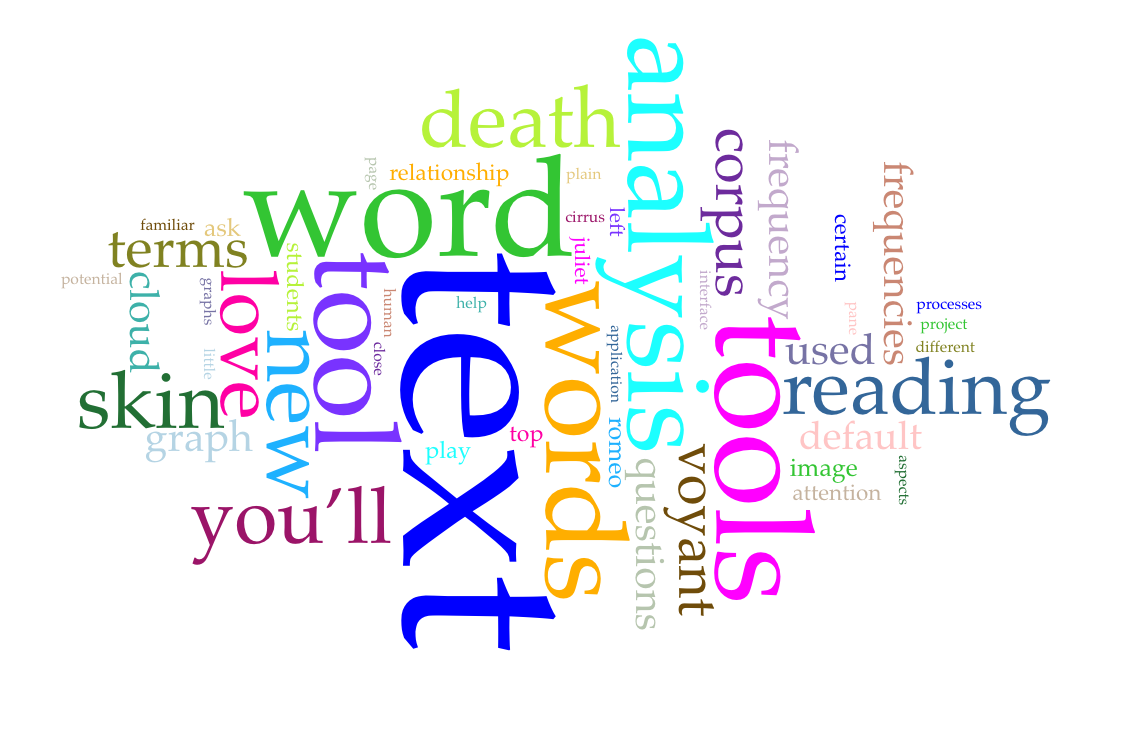
What do you know about text analysis (also known as text mining)? If you’re familiar with data mining, or extracting information or patterns from data sets, you can probably imagine how the same processes may be applied to text. Text analysis uses computational methods to extract or categorize certain words, phrases, and other aspects of texts, so that they can be further analyzed and interpreted by human eyes. A popular example of text analysis is the word cloud, which measures the frequency of often repeated words throughout a text. The bigger the word in the cloud, the more often that word appears in the text.
What if text analysis could help with teaching the research process? In particular, with guiding students toward asking thoughtful and interesting research questions about the text? As opposed to traditional “close reading”, text analysis facilitates what many scholars call “distant reading”. In “distant reading”, texts can be analyzed at speeds and magnitudes way beyond human abilities. Because text analysis allows readers to see what may have been familiar in new, unfamiliar ways, it can also help with identifying previously overlooked or obscure aspects about that text.
I find a tool for text analysis, called Voyant-Tools, particularly conducive to the undergraduate classroom. Voyant Tools is a web application, developed out of earlier iterations by Stéfan Sinclair (McGill University) and Geoffrey Rockwell (University of Alberta). It functions as a one-stop-shop for text analysis, offering an easy to use interface that processes text in seconds, organizing it into a series of interactive lists, charts, graphs, and networks. The application then allows users to play with the resulting visualizations, to further explore the text from different angles, such as term frequencies, contexts, and relations. The result is to leave you with a new vantage over your text, in a position to identify areas of interest and ask more questions. In order to demonstrate what I mean, I’ll walk you through how this tool might be used in the classroom with the example of William Shakespeare’s play, Romeo and Juliet.
First, you’ll want to put students into small groups (three or four students per group is ideal). Make sure that each group has a laptop with internet connection. Then, you’ll direct them to a plain text version of your reading material, in this case, Romeo and Juliet. You can find this text, and many others in the public domain, on Project Gutenberg. (If you’re not already familiar with this resource, Project Gutenberg is a database of public domain texts in various formats—html, epub, kindle, and plain text.) For our purposes, we will use the plain text version. Tell your students to copy the entire text, leaving out the front and back matter that contains Project Gutenberg’s publication information.
Once the text is copied, navigate over to the Voyant Tools website (www.voyant-tools.org), and paste the text into the empty textbox at the center of the page. At this point, we can call this text your “corpus”, a fancy word that means a collection of text(s) that functions as data. Then, press the button that says “Reveal”.
You’ll then be confronted with a whole page of visualizations, which should look similar to the image below. There will be five panes (or little windows) across your screen, each with a different visualization, which represents a different tool. The tools are little text analyses that the application immediately runs on your uploaded text. This initial selection of tools is called the “default skin”. You can actually modify the skin, changing out one tool (such the “Cirrus”, or word cloud) for another one (such as “Correlations”). For now, though, let’s review the different tools across the panes of the default skin.
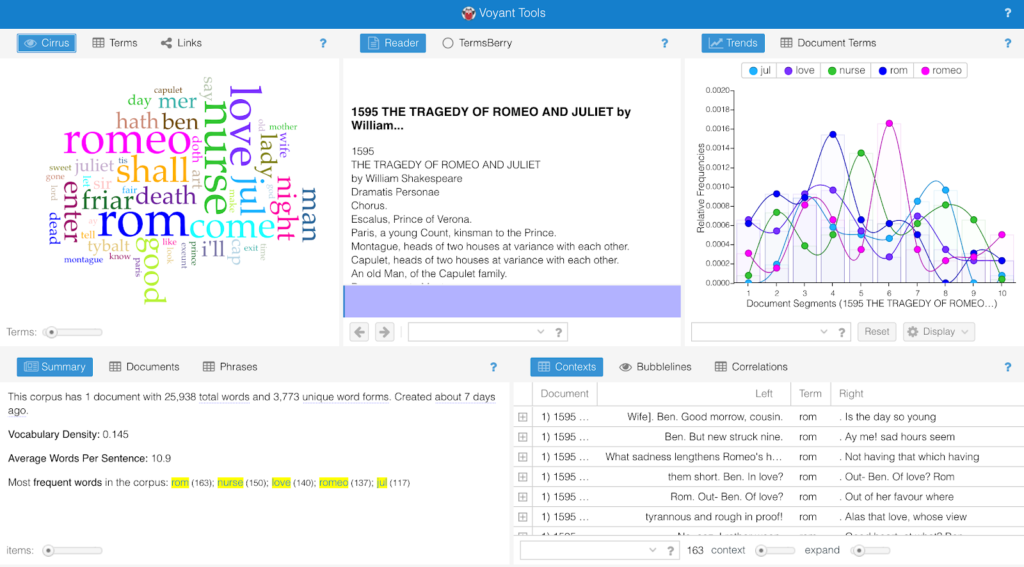
The Voyant-Tools interface after uploading Romeo and Juliet
First, on the lower left pane of the skin, you’ll see “Summary”, which provides a simple quantitative overview of your corpus, including total number of words, vocabulary density, words per sentence, distinctive or unique words, et cetera. Then, on the upper left, you’ll see the “Cirrus” (or word cloud) tool. This tool counts the most used words from your corpus, and displays them in various sizes, relative to their frequencies. Pay attention to the colors of specific words, because these will be re-used for the same terms across other tools. One of the benefits of Voyant is the dynamicity of the various tools—selecting a word in one window will automatically reload the visualizations in the other windows to further analyze your selection. Next, in the upper center pane, we have the “Reader” tool, where the full text is displayed for reading. Here, you can hover over a word to show its frequency, or click on a word to find other instances of it in the corpus. Again, due to the dynamicity of the interface, when you click on a word in the “Reader”, you’ll find that the “Trends” pane reflects that selection. The “Trends” pane, on the upper right, graphs the frequencies of the top five words across the length of the corpus. The x-axis, “Document Segments”, functions like chapters that Voyant Tools uses to divide up the text by equal lengths; the y-axis is the raw frequency for that word. Finally, on the bottom right pane, you’ll see “Contexts”, the occurrence of a selected word with a bit of the immediately surrounding text.
I suggest giving students an opportunity to play with the text and explore the extensive range of tools on the default skin and beyond. To really understand the power of these tools, and the level of customization built into the interface, dedicate some time to just messing around and being spontaneous. Because the charts and graphs allow users to encounter the familiar text from an unfamiliar angle, some new detail might catch their attention, or spark curiosity about something they hadn’t yet thought about. It may also bring them to ask a question that they never considered before.
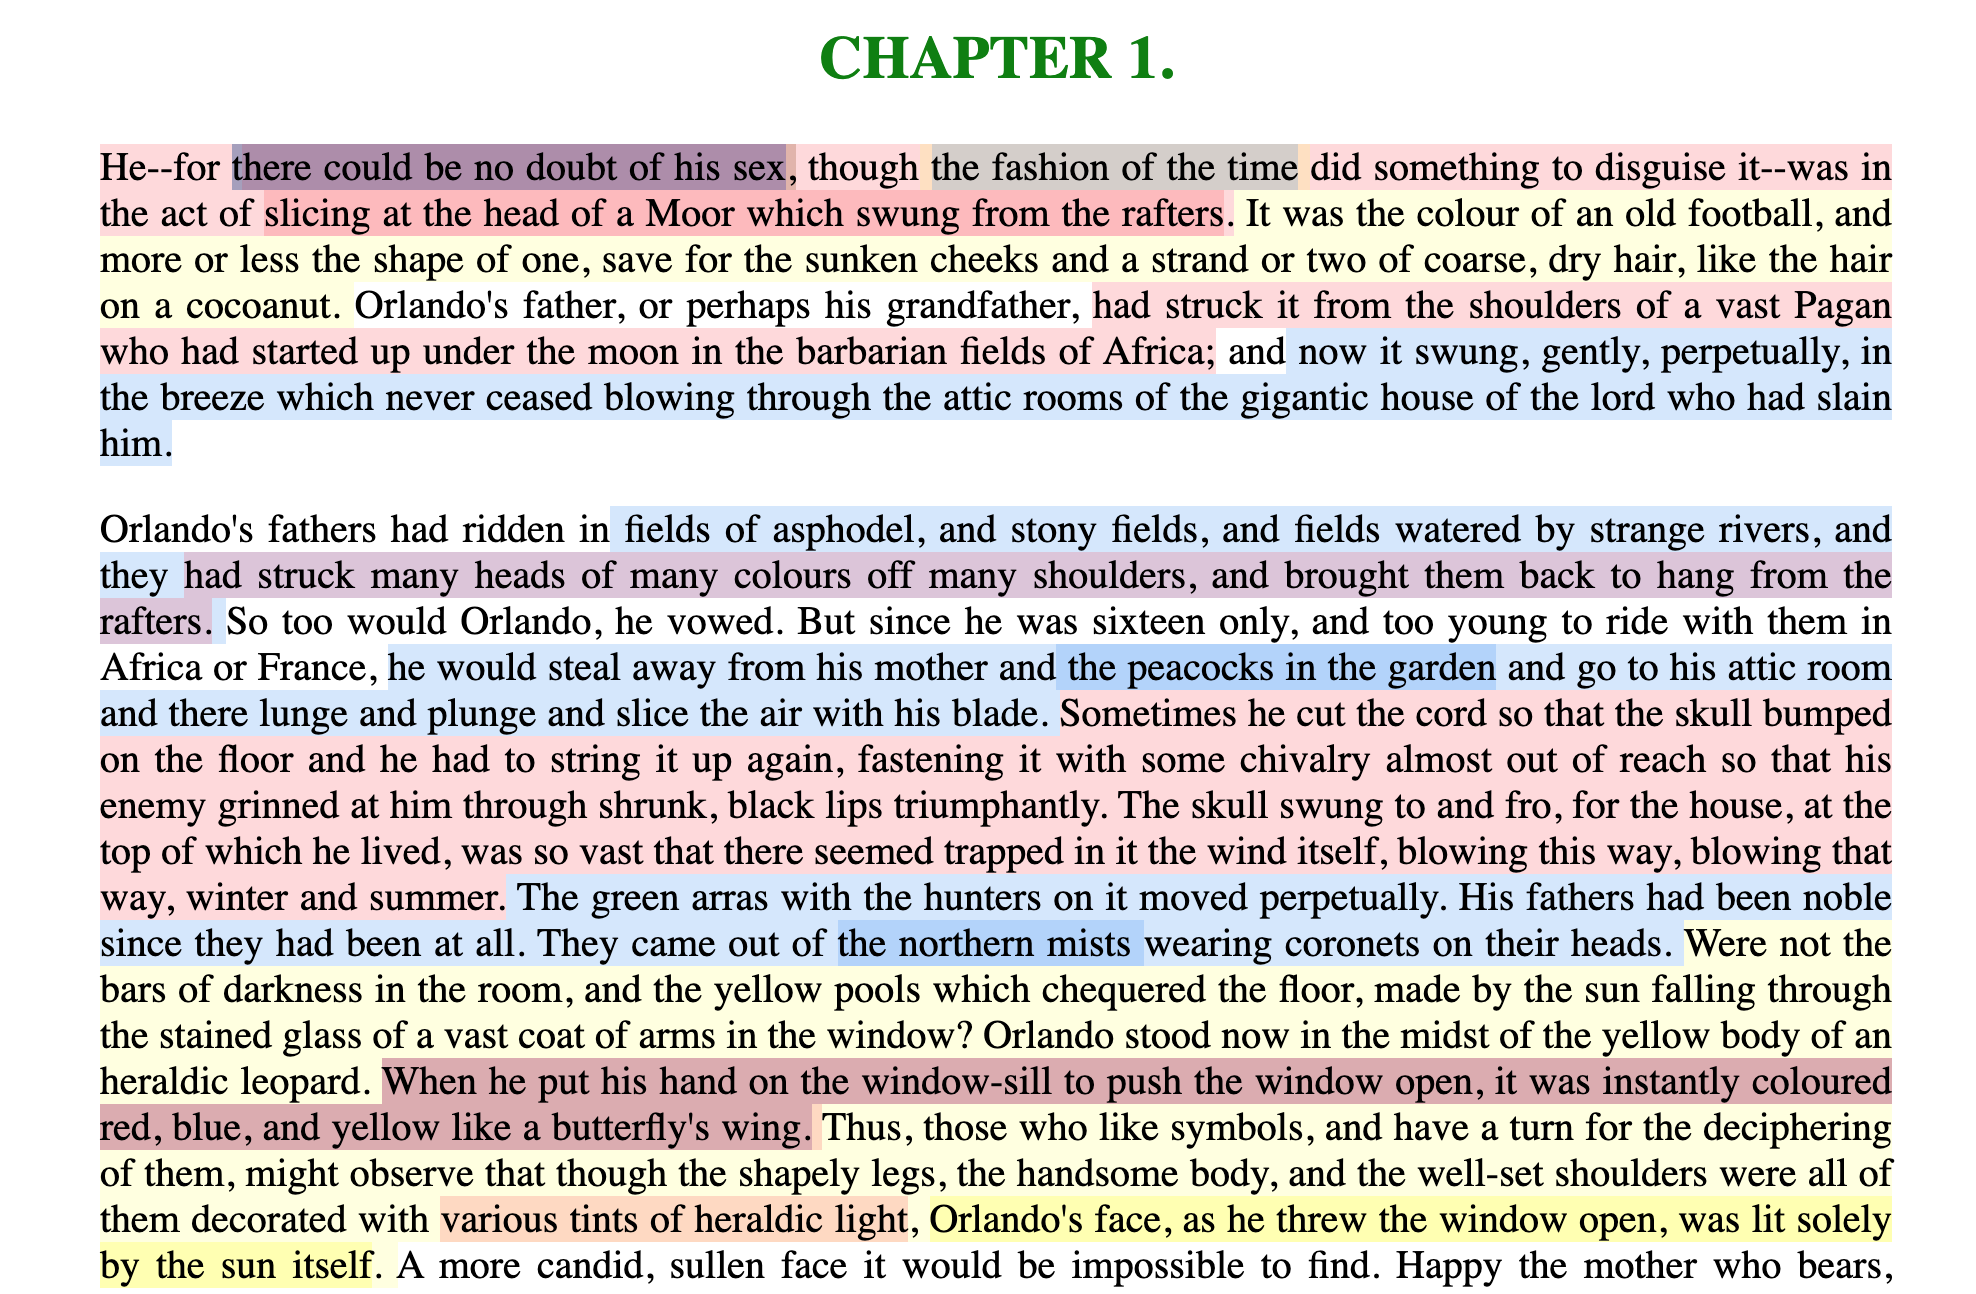
I’ll close this essay by showing one specific way that the tool can be used to help with formulating research questions. First, reload the default skin for “Romeo and Juliet” to its original settings. Then, turn to the “Trends” tool (the word frequency graph at the top right of the page). The graph should now display the top five terms of the corpus. You will get rid of these terms and input custom terms of your choosing. You can input custom terms by navigating to the little bar on the bottom left corner of this panel, and adding words of your choice. Below you’ll see an image with two terms—“Love” and “Death”—selected.

Graph of the frequencies of “Love” and “Death”
Compare the frequencies between “Love” and “Death”. Do you notice anything interesting? They show an inverse relationship: where “Love” occurs most often, “Death” has a low frequency; and where death is prominent, love diminishes. This inverse relationship—which might seem unremarkable on the surface—indicates that there is more work to be done on examining the associations between love and death. Most importantly, it points to areas of tension in the text that the reader can re-read more closely. These collisions between “Love” and “Death” present potential sites of further questioning: what is the exact nature of this relationship? How might the two seemingly opposite forces be connected?
Using text-analysis in this way inspires new readings by bringing to light neglected, miniscule, or concealed aspects about texts. It identifies certain words or patterns of language that escape the notice of even the most diligent and perceptive readers, opening the text to new questions and insights. The defamiliarization of what we think we know and hands-on experimentation with texts encourages readers to speculate about other possibilities, and experience more active and playful approaches to inquiry.