NEH Open Data
Shortly after the Trump administration announced its budget, the GC Digital Fellows dove into the Open Data from the National Endowment for the Humanities (NEH) to see what we could learn about what has been funded and what sort of projects would no longer receive funding. With a hope to share the rapid forays into the data, Jojo wrote up the team’s initial efforts to let people know what were thinking about and how, and to ask people to think with us. We have received enthusiastic response and feedback, which we have been hard at work incorporating into our next steps. This blog post outlines the continuing efforts of the GC Digital Fellows to visualize and disseminate information about NEH funding. As we learn more about the data through our investigations, we continue to refine our work. We hope readers can take away from these intermediary, process posts a sense of how we’re working and our strong encouragement to undertake their own investigations.
The Data
This dataset is a rich exploratory tool because it lends itself to many different forms of analysis. It’s a time series so we can do trend analysis in how awards change over time and it’s geospatial so we can look at differences in funding in different places. The data comes in all types, from quantitative award amounts to categorical program and institution types to free form textual data in the form of project titles and descriptions. And there’s a lot of it spread over six decades, 50 states, a number of foreign countries, and many scholars and institutions– so we are navigating the balancing act between showing the forest and the trees.
There is still a lot for us to learn about the NEH’s open datasets, but here is what we know so far:
In December 2016, the Obama Administration published a fact sheet outlining the effects of the 2010 commitment, The Open Government Partnership, including “President Obama’s call to develop specific commitments to promote transparency, fight corruption, energize civil society, and leverage new technologies.” Of particular note are items 21 through 30 regarding the policy move toward Open Data. In addition to allowing people right to access and donate their own health data for research, to opening policing data and giving energy users access to their own data, connecting local and national data, and many others, the OGP proposed making 200,000 datasets available to students, entrepreneurs, and the public on Data.gov. These efforts have included outreach to get people interested in working with the information. Read more and more. The NEH released its first Open Dataset on September 27, 2015. In their press release, the leaders of the NEH explain that the dataset is comprised of around 12,000 grants awarded from 1966 – 1979 and represents their efforts to digitize their records. Links to other projects demonstrate ways people have applied this data.
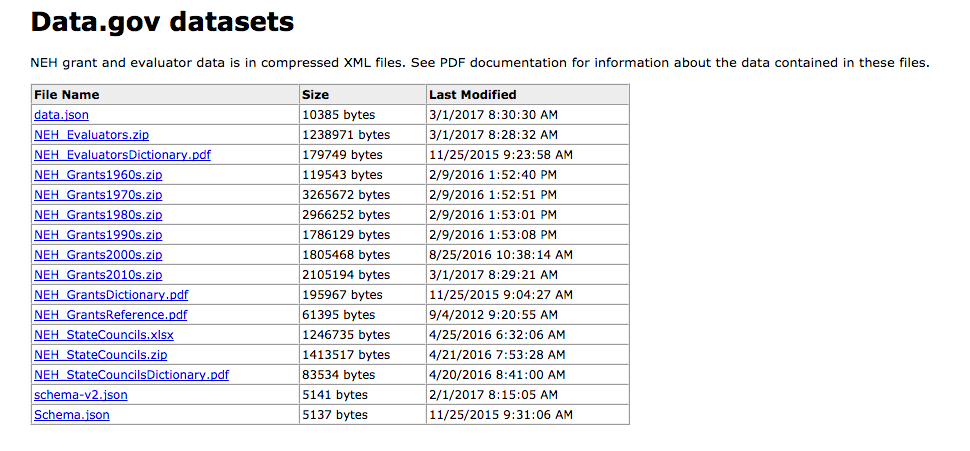
The NEH makes data available to the public in two ways:
- Datasets may be downloaded in json (JavaScript Object Notation) files. This data interchange format is easy for machines to parse and legible to programmers familiar with C-family of languages (C, C++, C#, Java, JavaScript, Perl, Python).
- Funded Projects Query Form (https://securegrants.neh.gov/publicquery/main.aspx) offers an interface for calling specific information from the dataset. Searches from this form can be exported to an Excel spreadsheet. You don’t need to fill all the fields to run the search. For instance, you might look for grants awarded in 2016 by only filling in beginning and end dates, or for grants awarded in a specific field.
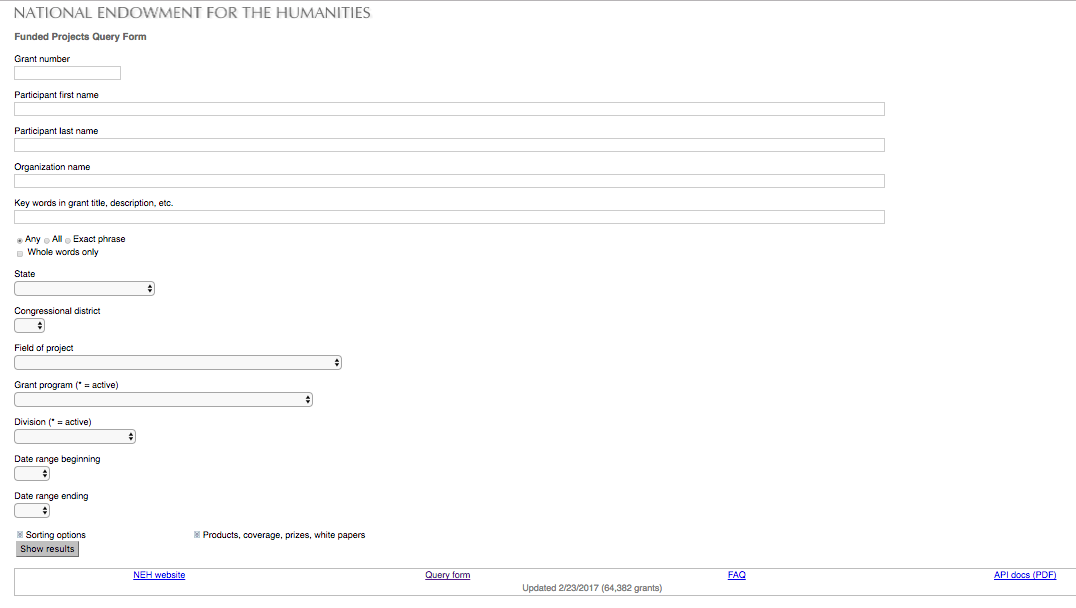 The query form has a FAQ to help you determine how to retrieve data relevant to your question.
The entire 1966 – 2017 NEH dataset is vast, to say the least. How do we break down the data? What unit of time do we divide by? How do we examine change in a way that responds to the data we have been given and our knowledge of the structures the grants operate within? The NEH Grants Dictionary included with the data expands field headings, but even with the contextual information provided in NEH_Grants Reference, these many grant categories can seem somewhat opaque. As students in different fields (Urban Education, Computer Science, Psychology, English, etc), we come to the data with different perspectives and different personal experience of the grants. With guidance from Lisa Rhody, we waded into the tricky distinctions and overlapping categories. Each year grants are funded in cycles. To visualize the distribution of funds, which may change over the life of even a single grant, we are experimenting with different timeframes.
The more familiar we become with the dataset, the more we find to learn. At first, we were advised to examine the outright awards as a way to isolate money that went directly to institutions and did not require matching funds from private corporations. As we get to know more about how the different awards work (a complex system of distribution with necessarily strict parameters for fund usage), we must consider other distinctions, for instance whether to omit the funding for the state humanities councils or include them in the sum. Some grants that look like duplicates may include supplemental funding, which we did not account for when we started.
We were initially working with outright awards, by which we mean funds directly granted to organizations. From the data the NEH makes publicly available, we isolated the Outright Awards from those that required matching funds from other sources (like awards that come with the requirement that the institution acquire equal funds from private corporations or other non-profits). We are still working to determine which parsing of the funds will give us the clearest sense of where the money has direct impact. The fellows working on this data began with values that seemed like the nearest proxy for amounts given. Open Data is extremely valuable, but it requires close examination of the fields. Collection of the data reflects structures that are not always transparent. As graduate students, not grant organizers or legislators, we are working through this information and learning as we go. Our explorations aim to make transparent the recipient side of the data. Once we had the amounts, we broke them down by state.
What do our initial visualizations reflect?
The NEH grant amounts recorded in the spreadsheet varies very widely, from the really small to the quite large. The University of California, Riverside received $4,180,768 for “California Newspaper Project: Cataloging,” which is one among many preservation and access projects pre-1996 that received awards in the millions in 1991. In that same year, Harvard Semitic Museum received $0 in outright and matching awards for “Publication of the Wadi Daliyeh Seal Impressions,” which is a Travel to Collections, 11/85 – 2/95 grant. What complicates these allocations further when using the award outright amount is that some projects were awarded negative amounts but received funds as matching awards. In 1984, Princeton University Press was awarded -1041.77 for “Purchase of Penta Tele/Media Interface for Translating Word-processing Codes” (Scholarly Publications), but earned $11,748 in matching funds.
The collection of all outright award measurements, which are the dollar amounts given to the university, is called the numerical scale of the measurement, and in this dataset the scale for award outright goes from about -1000 to almost $10,000,000, with every number in between. This range is really really difficult to visualize using colors (like the maps we’re making) because it’s hard to figure out what rules we should use to translate the numbers to colors. The first step is choosing which set of colors (called colormaps) we want to use. Tools as varied as Excel and Tableau Public, Python and R, arcGIS and CartoDB, typically provide colormaps with only a few really distinct shades — usually 7 or 10, recently up to 20.
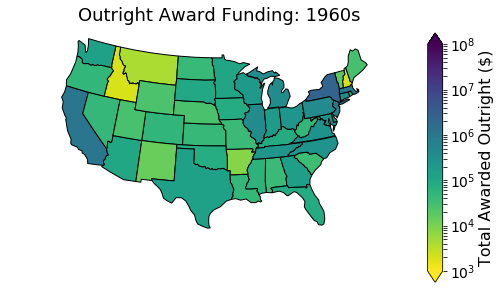
If funding were distributed perfectly equitably across all states, each state would get about 2% of overall NEH funding. In the 1960s, states received between 20% and .5% of overall funding. States that received anything less than %2 (even a fairly equitable 1.5% percent) appear to receive no funding because the colormap we used does not distinguish well between 0 and 2.5.

Colormpas also don’t clearly distinguish between -1000 and 10,000,000. Since we wanted to highlight the differences in the funding, we shortened the gaps between -1000 and 10,000,000 using a logarithmic scale. This scale essentially groups the data by powers of 10 so that amounts $1000-$10,000 are represented by yellow, $10,000-$100,000 by yellow green…
The spread in the data from 1000 to 100,000,000 is in part because the data spans 6 decades. Inflation alone accounts for amounts getting larger. Good practice states that images in a series, such as maps of the same thing across decades, should have similar scales…but in a previous iteration of the earlier post the maps hadn’t been adjusted for inflation and so differences between states in later decades were sometimes indistinguishable since they were subject to a scale that could also handle much smaller numbers. This mix of scale and color difficulties also obscured a coding bug wherein the states were colored using a different state’s values.
While log scales offer helpful ways to demonstrate big leaps in value in a short visual space, they are unintuitive to an audience unfamiliar with logarithms. That realization is important because the audience for these visualizations really should be a much broader public. One of the many things we’re discussing is how to work with numbers that span such a large range and how to better visualize the geographic distributions of these numbers for an interdisciplinary, largely humanities-focused, audience.
What scale gives us a sense of who is benefitting?
As we explore the data, we are trying to figure out what visualizations will give people the strongest sense of NEH impact on their lives. Does it help to show titles of projects by state? Do people want to click through state by state to see funding amounts?
We are currently comparing the funding between states. How much money has the NEH awarded institutions in each state between state humanities councils and independent scholars winning on behalf of their institutions?
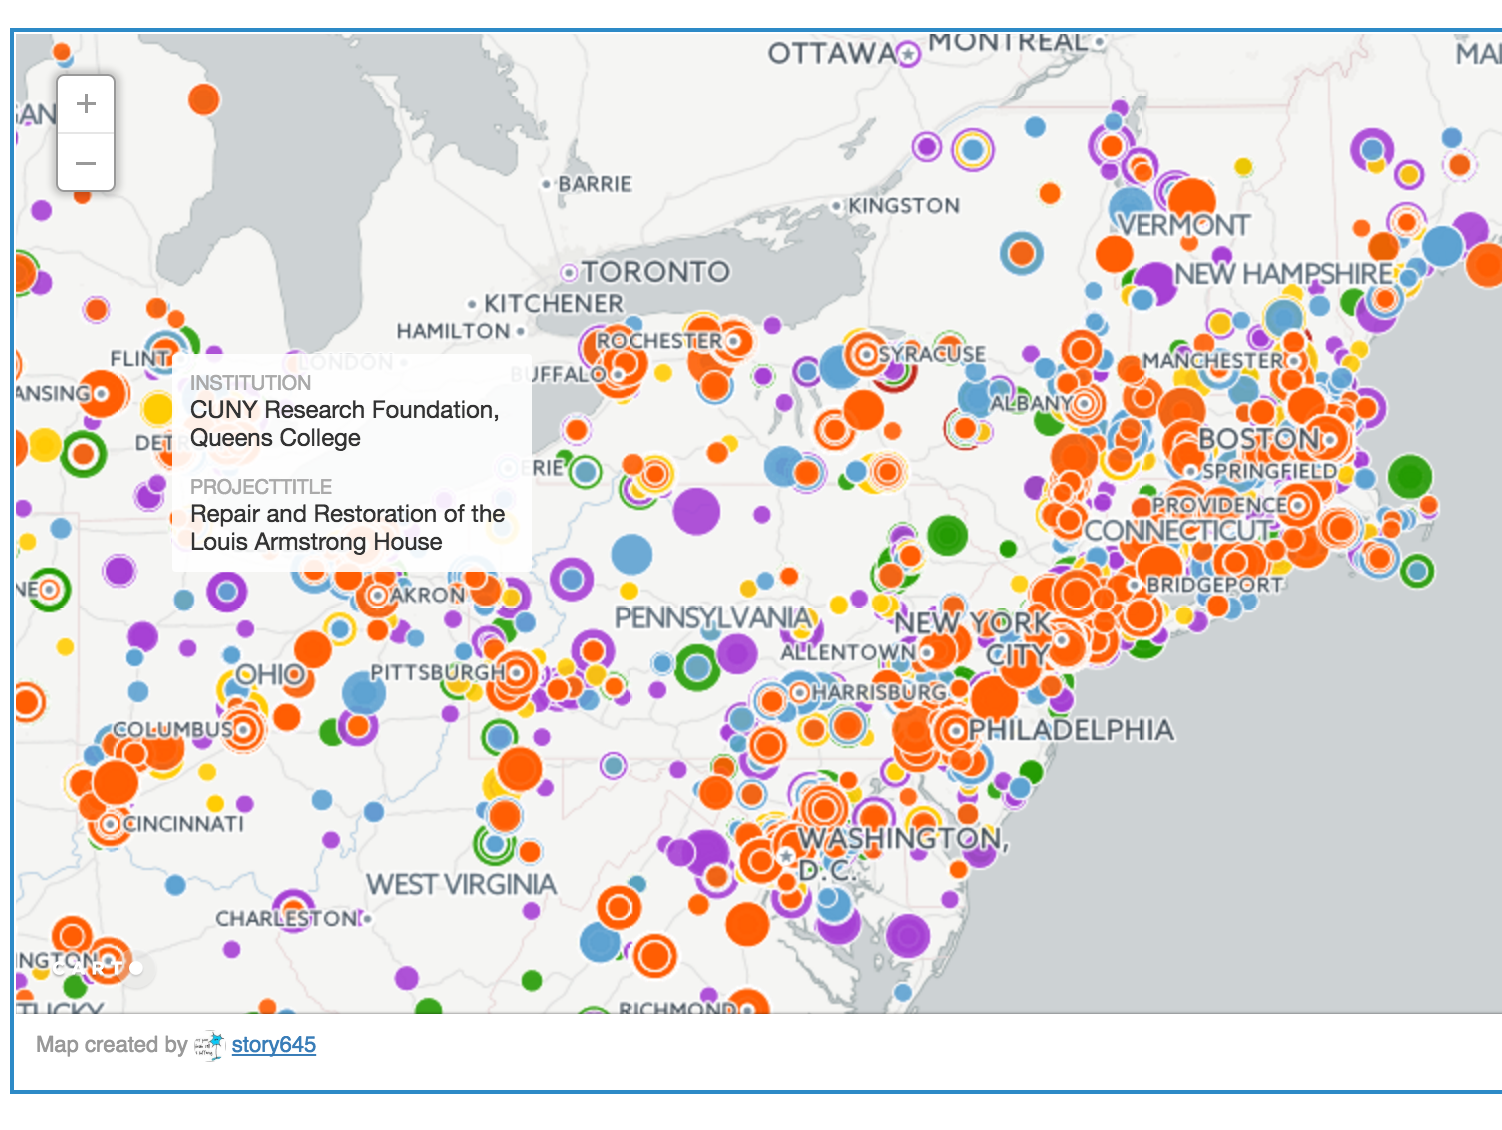
Hannah Aizenman created an interactive map on CartoDB, a Software as a Service cloud computing platform, to show the distribution of awarded outright funding. (See digital fellow alum Michelle Johnson-McSweeney’s mapping handouts to help you build your own).
NEH_MAP
Map created by story645 in CARTO
Each point is a single award, colored by the decade in which it was awarded. The dots are scaled proportionally (which is called a bubble chart) such that the smallest dots are the bottom 10% of awards in that decade, the dots that are just a little bit bigger are the next 10% of awards, and the dots increase in size such that largest dots are the top 10% of awards in that decade.
Why maps?
Maps have descriptive power because they give people a frame of reference for how the thing being measured affects them. People see the funding in their city or state and can attach it to institutions they’ve heard of, gone to, maybe even work for. The guiding principal for why we chose to start our spatial analysis by looking at the total amount awarded per state is a classic mantra in data visualization: “overview, filter, details-on-demand.” It advocates starting with a high level aggregation of the data to get a sense of the patterns in it and then drilling down into the observations that make up the dataset. We started with states because they are the largest geographic division in the dataset that still retain meaning for comparative purposes.
As we unpacked the data further, we started question whether state lines, and even cities, as the markers of population distribution obscures the reach of certain papers and projects and employment that derives from these funds. Though they give at best a summary visualization of data, maps may provide a useful visual point of entry to disseminate data.
NEH_MAP
Map created by story645 in CARTO
So what does state distribution show us? As we parse the amounts state by state, we have to ask what story that would tell. If funds are awarded on a project by project basis, what does locating those funds by state boundaries indicate? If we consider the state lines as markers of population distribution, the visualization might obscure the reach of certain papers and projects and employment that derives from these funds. An issue with assessing these funds this way is that a large number of grants awarded go to large institutions that may not necessarily span the population of the given region.
What is the most effective representation?
“Effective representation” brings up the question of effect. What effect are we hoping to achieve? We want to allow the data to tell us things we might not know and we also want to find evidence of the strong impact of these awards that we, from personal experience, perceive. Many in our group, and certainly at our institution, have benefitted from the opportunity NEH grants provide. As researchers, we are curious about different things and finding the best way to approach this material takes a lot of consideration.
What are our next steps?
In addition to further investigation of the the data, we are thinking about ways people might want to engage with the information about grants and to provide access to this sort of work for other students. A number of Digital Fellows have been hard at work to make the information discoverable, and make the way they work reproducible. Stay tuned for upcoming blog posts! We hope to reach out to groups at CUNY and we encourage interested parties to comment below, tweet @Digital_Fellows, or contact us at gc.digitalfellows@gmail.com (Thank you for the emails so far!).

This entry is licensed under a Creative Commons Attribution-NonCommercial-ShareAlike 4.0 International license.


