Given the wide array of mapping tools available, it could be hard to know which ones will best suit the needs of a given project. This post will review and compare six of the most popular mapping tools available so you can find the right tool for you. If you don’t currently have a mapping project in mind, this guide could be a helpful resource to get a sense of the possibilities.
Here are some basic questions to start off with that will help you narrow down your options.
- Do you want your final map to be static (an image) or interactive (a web-based application)?
- Would you be willing to pay for a service?
- What is your time commitment? Do you have the time to learn higher level mapping skills, which is better for doing a spatial analysis, or do you want a tool that can allow you to make a map quickly because you just want to visualize spatial data?
- Will you be working in a team? Might you need a shared platform for creating your map?
For the ease of comparing each mapping tool, I have created a standard rubric based on these questions. Additionally, I have grouped the tools into two main categories—tools for creating static maps and tools for creating interactive maps. Let’s review each one!
Compose static maps
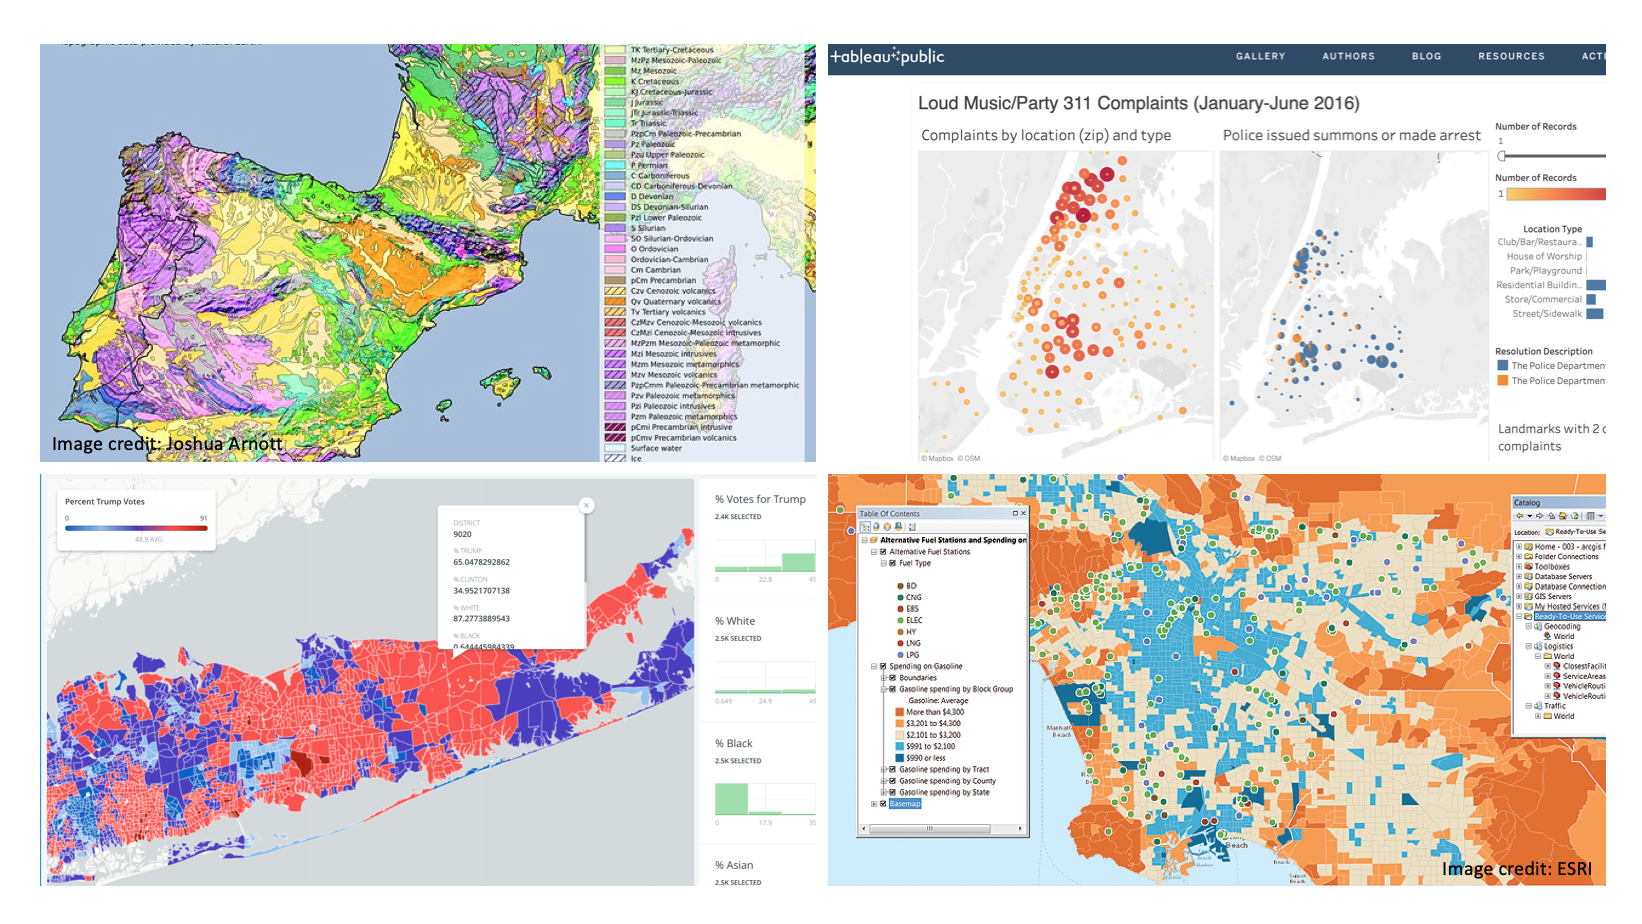
ArcGIS Desktop and QGIS are the main options for creating composite static maps. These tools are best for performing high-level spatial analyses—functions such as combining different spatial layers, clipping layers to a particular bounded area, and creating buffers around a set of features—and for creating high-resolution maps that can be used in print publications. Both tools require clean data, so correcting or deleting inaccurate values needs to be done before the data is put into these mapping tools. While the interfaces are different, the skills for using these services are the same, so if you know how to use one you will easily be able to use the other. Both ArcGIS and QGIS are software that you download onto your computer.
ArcGIS Desktop
ArcGIS Desktop is an industry standard. It can create high-resolution maps that are suitable for print publications. Additionally, you can turn your static maps into interactive web versions by using ArcGIS Online, another subsidiary of ArcGIS.
Company: ESRI
Proprietary or Open Source: Proprietary.
Cost: Students can purchase a 12-month license of ArcGIS Desktop for $100 a year. All Graduate Center students have free access to it on the Mina Rees Library computers. The regular professional use plan is $700/year.
Sharing: Export as image, PDF or SVG. In addition to SVG, it also includes other vector export formats.
Ease of Use: Intermediate to Advanced. There’s a significant learning curve, but there are lots of documentation and tutorials available online.
Strengths:
- It is the “industry standard”—government offices and private sector companies will likely want to rely more on proprietary ESRI than on open-source QGIS. Still, knowing how to use one is practically knowing how to use the other.
- Lots of free or low-cost online classes.
- Incorporates the latest mapping and spatial analytics technology, such as 3D GIS.
- Offers a collection of integrated, location-based apps, such as ESRI Story Maps, which is great for adding context around your map.
- Geocodes addresses—it can look up addresses and plot them on a map
Weaknesses:
- Single-platform—It only works on PCs (sorry Mac users!).
- Training is necessary and there is a significant learning curve in order to feel comfortable with navigating the software.
- Proprietary software: it costs money.
QGIS
QGIS is very similar to ArcGIS except for two big differences—it’s FREE, open source, and multi-platform, which means that it is also available for Macs!
Company: Open Source Geospatial Foundation (OSGeo)
Proprietary or Open Source: Open Source.
Cost: Free.
Sharing: Export as image, PDF, or SVG.
Ease of Use: Intermediate to Advanced. Just like ArcGIS, there is a steep learning curve for QGIS. CUNY offers several introductions to QGIS workshops throughout the year. Sign up for the GIS Working Group to get notifications about upcoming workshops. Also, check the GCDI calendar.
Strengths:
- It’s free!
- Multi-platform.
- Consumes all type of data. QGIS uses the GDAL/OGR library to read and write GIS data formats. Over 70 vector formats are supported.
- Its capability is comparable to that of ArcGIS; however, rather than having most of the functionalities integrated with the initial software download, for QGIS you have to add plugins through an external library. Since QGIS is open source these plugins are created by a public community of volunteers. The plugins are ranked and rated so you can get a sense of the ones that have been most helpful to other users.
Weaknesses:
- New versions are released on a developing basis, which means newer versions can be unfinished or untested. Since testing is done by volunteer developers, recent versions may have more bugs/inconsistencies that are polished in future versions.
- ArcGIS has applications that are all integrated under the ESRI brand, such as ESRI Story Map, which creates a story around your map, or ArcGIS Online, which turns your static map into an interactive map. QGIS must be combined with third-party applications, such as ArcGIS Online in order to achieve similar goals. This creates some extra steps for the user.
- Does not have a feature for geocoding addresses, so it requires plugins and external APIs to do this.
Overall Comparison between ArcGIS Desktop and QGIS
In terms of functionality, ArcGIS Desktop and QGIS are very similar. The advantage of using ArcGIS is that all of the extensions have been tested and approved by the company, which means that they will rarely have glitches. Because of its open-source nature, QGIS relies on plugins that are created by the public, so the user has to go through a few more steps to choose the right plugin and make sure it’s reliable. The two major benefits of QGIS is that it’s free and it works on PCs and Macs.
| ArcGIS | QGIS |
|---|---|
| $100/year | Free |
| Proprietary | Open Source |
| Single-Platform | Multi-Platform |
| Industry Standard | Not (yet) as popular with businesses |
| Structured Platform | More Modular |
Create Interactive Maps
ArcGIS Online, Carto, Tableau and Leaflet are four popular options for creating interactive maps. Unfortunately, only the latter of them is open source, so the rest have limitations with regard to accessibility. For example, while ArcGIS Online offers a free version, its functionalities are very limited and the licensed version is prohibitively expensive for many students ($500/year). Fortunately, there are workarounds to these limitations, which are discussed in the overviews below.
ArcGIS Online
ESRI’s ArcGIS Online is a cloud-based mapping platform. Users can create a free ArcGIS Public Account; however, the public account is limited in its capabilities. It has a limit on the number of features that can be displayed on a map—allowing up to 1,000 features—and it does not include the use of spatial functions; even common functions such as spatial joins are not available with the public version. ArcGIS Online is a good option for projects that simply require visualizing data, as opposed to doing any type of analysis. There are some workarounds if you combine a few different mapping tools. For example, if you wish to only use free mapping tools, you could easily do your analysis using QGIS and then upload the completed map into ArcGIS Online in order to make it interactive and shareable on the web.
Company: ESRI
Proprietary or Open Source: Proprietary.
Cost: Free for very limited use or $500/year for the full subscription.
Sharing: Sharable URL, embed code
Ease of Use: Intermediate to Advanced. The interface and functionality for ArcGIS Online is similar to ArcGIS Desktop.
Strengths:
- Easily integrates with apps, such as ESRI Story Maps.
- Can be shared online and embedded into websites.
Weaknesses:
- Limited to 1,000 features with the public version.
- The full version is very expensive.
- Limited choice of geoprocessing operations (compared to desktop version).
Carto
Carto is a popular mapping service for making interactive maps. Due to its drag and drop interface, users tend to find it to be easier to use than ArcGIS Online. However, the pricing scheme is a big issue since it’s not transparent and changes often.
Company: CARTODB Inc
Proprietary or Open Source: Proprietary.
Cost: Students can get 2 years of access for free. You will need to sign up with GitHub’s Student Developer pack as explained in this article. It’s not clear how much the service will cost after 2 years; they don’t even have their prices on the pricing page. In some mapping forums, it’s reported that it commonly costs $149/month.
Sharing: Shareable URL, embed code.
Ease of Use: Beginner to Intermediate. Carto has an intuitive drag and drop interface.
Strengths:
- Intuitive and relatively easy to use.
- Incorporates widget-based dashboards.
- You can link to live excel documents, so your data automatically updates.
- QGIS has a Carto plug-in that links to your Carto account for added flexibility.
Weaknesses:
- Accessing the free student version has proven to be a difficult process for some users. Students must first sign up for a student account on GitHub, which requires an approval process, and then they can access the student subscription on Carto.
- Constantly changing their pricing.
- Unless you know Javascript, which is a coding language, it has limited customization options for the appearance.
Tableau Desktop
If you do not need to perform a geospatial spatial analysis on your data and want a quick way to visualize location data, Tableau is a great option. Unlike, ArcGIS Online and Carto, Tableau is a software that you download onto your computer. It has an easy drag and drop interface that even recommends ways to display your data. It also allows you to create a dashboard that displays your map in relation to other charts and graphs. When you want to share your map or dashboard you can simply upload it to the Tableau Public site and then you can share it with a public URL.
Company: Tableau Software
Proprietary or Open Source: Proprietary.
Cost: Free license for students and teachers. For individuals its $70 per month.
Sharing: Connects to Tableau Public and can be shared with a public URL.
Ease of Use: Easy. Takes messy data and data manipulation is possible within the program.
Strengths:
- Easy drag and drop interface.
- Good for maps that don’t require much manipulating. Think of it as a way to visualize location data without needing to perform a spatial analysis.
- Makes interactive maps.
- Includes popular forms visualizations, such as Choropleth maps, Proportional symbol maps, Point distribution maps, Flow maps, Origin-destination spider maps, Heat maps.
- Like Carto, the dashboard with the map can include widgets that help to filter the data.
Weaknesses:
- Cannot perform higher-level spatial analyses.
- The only way to share your map is to make it public and part of a searchable database on Tableau Public, so if you have sensitive data this could be an issue.
Leaflet
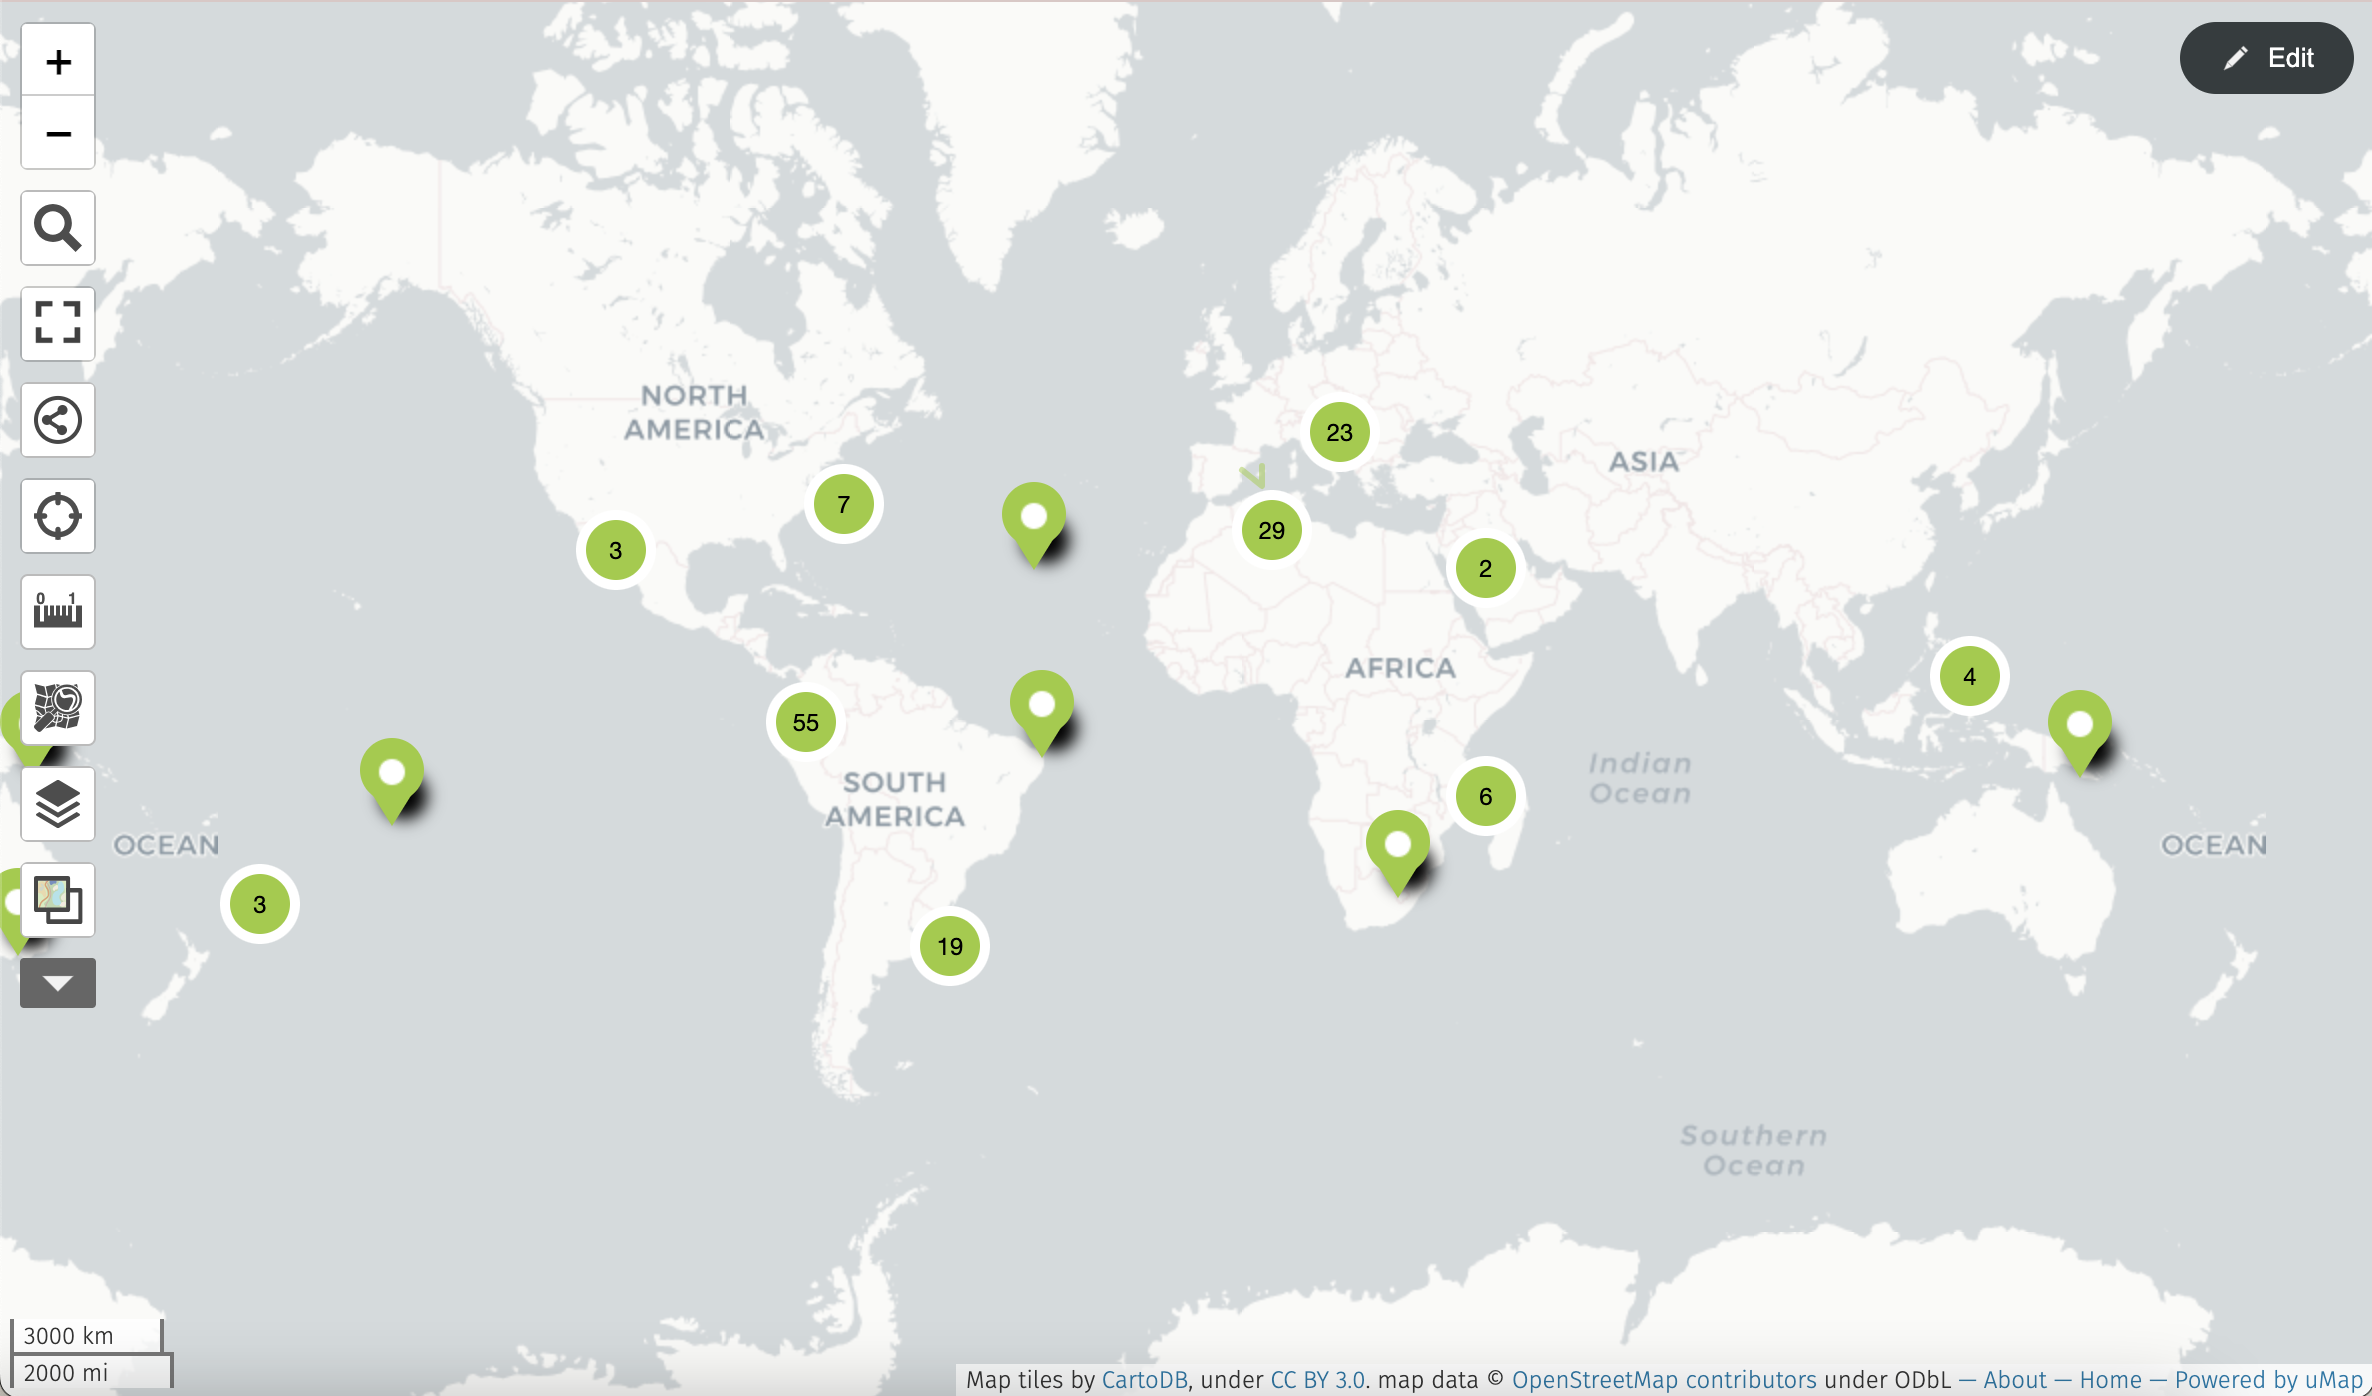
Leaflet is an open-source JavaScript library designed to create interactive maps that can be added to a web page. You might already have seen Leaflet-based maps if you have visited Flickr, The Washington Post, Facebook, Foursquare or Pinterest, to name a few. It is compatible with any platform, including mobile devices such as smartphones and tablets.
It is a library, which means Leaflet does not offer map tiles* (as in the images that act as a basemap), or layers of its own, so it relies directly on other sources that you have to connect to the code in order to display the map. In other words, although the code is open-source and free, the displayed tiles used in your maps must be attained from an external source, so there might be costs involved depending on what the other company charges. For instance, you can use ESRI maps in Leaflet (example here), but you will probably have to pay a fee to use those tiles. For instance, you can use ESRI maps in Leaflet (example here), but you will probably have to pay a fee to use those tiles.
Leaflet requires some basic understanding of computer languages and programming. The library has to be set up as a JavaScript class within the HTML code of the website you want to display the map in. Additionally, you have to connect it accordingly to the source layers (both raster and vector).
*Examples of map tiles that can be used in Leaflet
Company: None. Developed by Vladimir Agafonkin (now in Mapbox).
Proprietary or Open Source: Open Source.
Cost: Free.
Sharing: Can be inserted into pretty much any web page in the form of a code.
Ease of Use: Intermediate. Requires an understanding of basic computer programming and HTML coding.
Strengths:
- Free!
- Virtually endless possibilities of raster layers (limited by the availability of the providers), and many plugins to change the functionality and aesthetics of the interactive maps.
- Very efficient, light on resources (the library is only 38kb).
- Your data and files are stored in your own server, as opposed to a company’s server.
Weaknesses:
- No graphical user interface; requires knowledge of computer languages and programming. It’s easy to produce an error by forgetting a dot or a comma somewhere.
- Cannot perform spatial analysis (though there might be plugins to add some basic operations).
- Requires adding your own map tiles (raster layer). Although adds to the versatility, these are not always available for free.
- Limited file formats: prefers GeoJson, can read XML, but can’t read Shapefiles—they need to be converted using GIS software.
- Limited to Web Mercator projection (EPSG:3857), though this shouldn’t matter for most purposes.
Overall Comparison between ArcGIS Online, Carto, Tableau and Leaflet
ArcGIS Online and Carto are good options for making detailed interactive maps. Carto has the benefit of having an easy-to-use interface for beginners (if you can manage to get the free account), while ArcGIS Online is a better option if you want a robust way to contextualize your maps through using ESRI Story Maps. Tableau is a good option if you want a quick way to visualize your spatial data but are not interested in performing a spatial analysis. For quantitative heavy projects, Tableau also has the benefit of giving you a way to perform statistical analyses. Leaflet stands out regarding the wide variety of possibilities for displaying information and customizing the aesthetics of the map. The big barrier for many is that Leaflet requires an understanding of computer languages and programming, particularly in JavaScript.
| ArcGIS Online | Carto | Tableau | Leaflet |
|---|---|---|---|
| Free (limited use) | Free for 2 years for students | Free while student or teacher | Free |
| Proprietary | Proprietary | Proprietary | Open Source |
| Web-based | Web-based | Software + Web | Web-based |
| StoryMap Apps | Widgets | Widgets + Dashboard | Lots of plugins |
| Clean data | Clean data | Clean or Messy Data | Clean data |

This entry is licensed under a Creative Commons Attribution-NonCommercial-ShareAlike 4.0 International license.


