Throughout the past three years as a Graduate Center Digital Fellow, I’ve spent much of my time helping other students and faculty with their mapping projects. I’ve loved getting to learn about the rich range of research projects across disciplines. Though each project has been unique, I’ve noticed common challenges and frustrations that seem to exist for every mapping practitioner. I’ve also consulted with members of the GIS Working Group to collect their input on this topic. Thank you to everyone who shared their observations!
This article addresses some of the most common mapping mistakes so you can save yourself from these pitfalls and have a smoother experience in your mapping journey.
Cartographic Issues
Every mapmaker soon discovers that cartography is much more than making a map look good. The cartographic process is filled with subjective decision-making—which colors to choose, what data to visualize, what symbols to use—that can dramatically alter the final product. Poor decisions can lead to confusing or even misleading maps. Even beautifully designed maps can be cartographically inaccurate. To avoid this pitfall, take the time to become well-versed in standard cartographic best practices.
Here are some common cartographic mistakes:
1. Showing too much data. This is a mistake made by even veteran GIS practitioners. Mapmaking is a delicate balance between trying to represent a complex reality and producing a readable map. To help address this problem, find ways to contextualize your map, such as integrating your map into a Story Map or embedding it on a website where you can provide more information.
2. Adding unnecessary mapping elements. Beginner GISers are often so excited when it’s finally time to jazz up their map that they go a little overboard and include fancy scale bars and north arrows that are either unnecessary or that clash with the style of the map.
3. Using a multicolored categorization for quantitative data. Multicolored categorizations are best for qualitative data, such as a map that shows different types of vegetation. Additionally, the color choices shouldn’t be random but reflective of the category—woodland (brown), forest (green), tundra (white or light brown), etc.
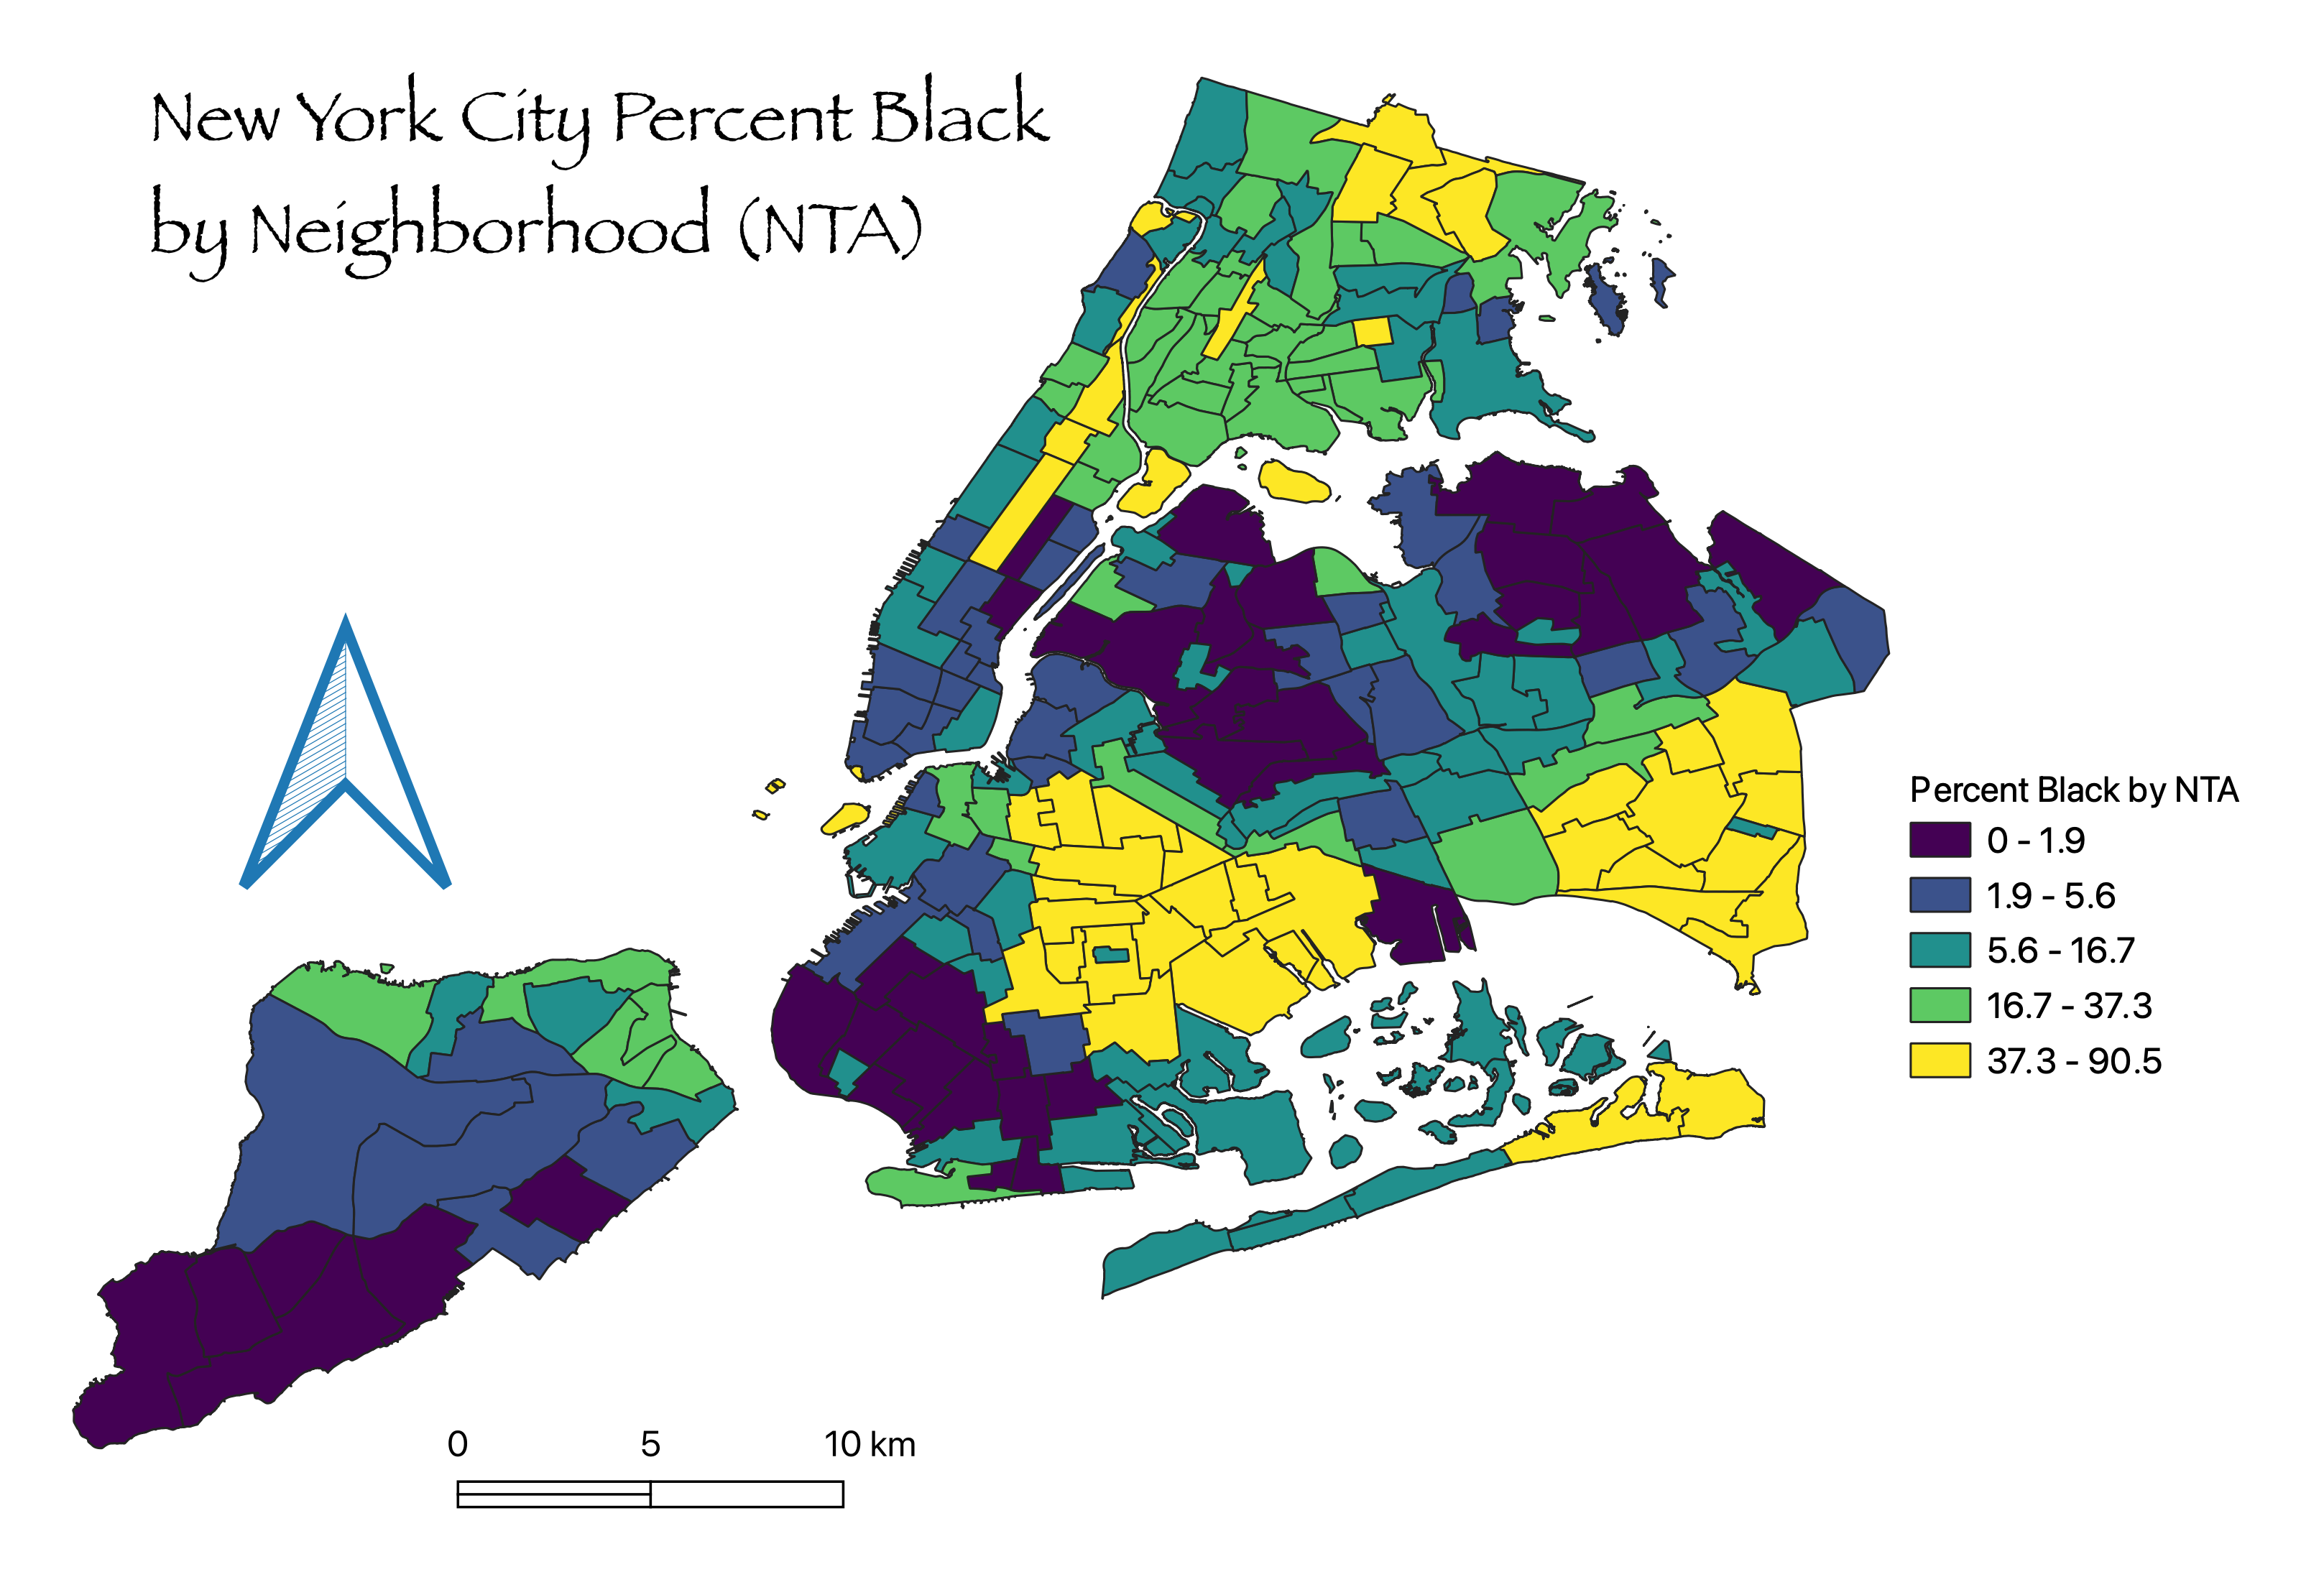
4. Using choropleth maps to display absolute numbers. Choropleth maps represent values by shading patterns. They should be used to display normalized data, which is data that has been compared to the whole population (e.g. rates, percentages, proportions, per capita values, medians, or averages).
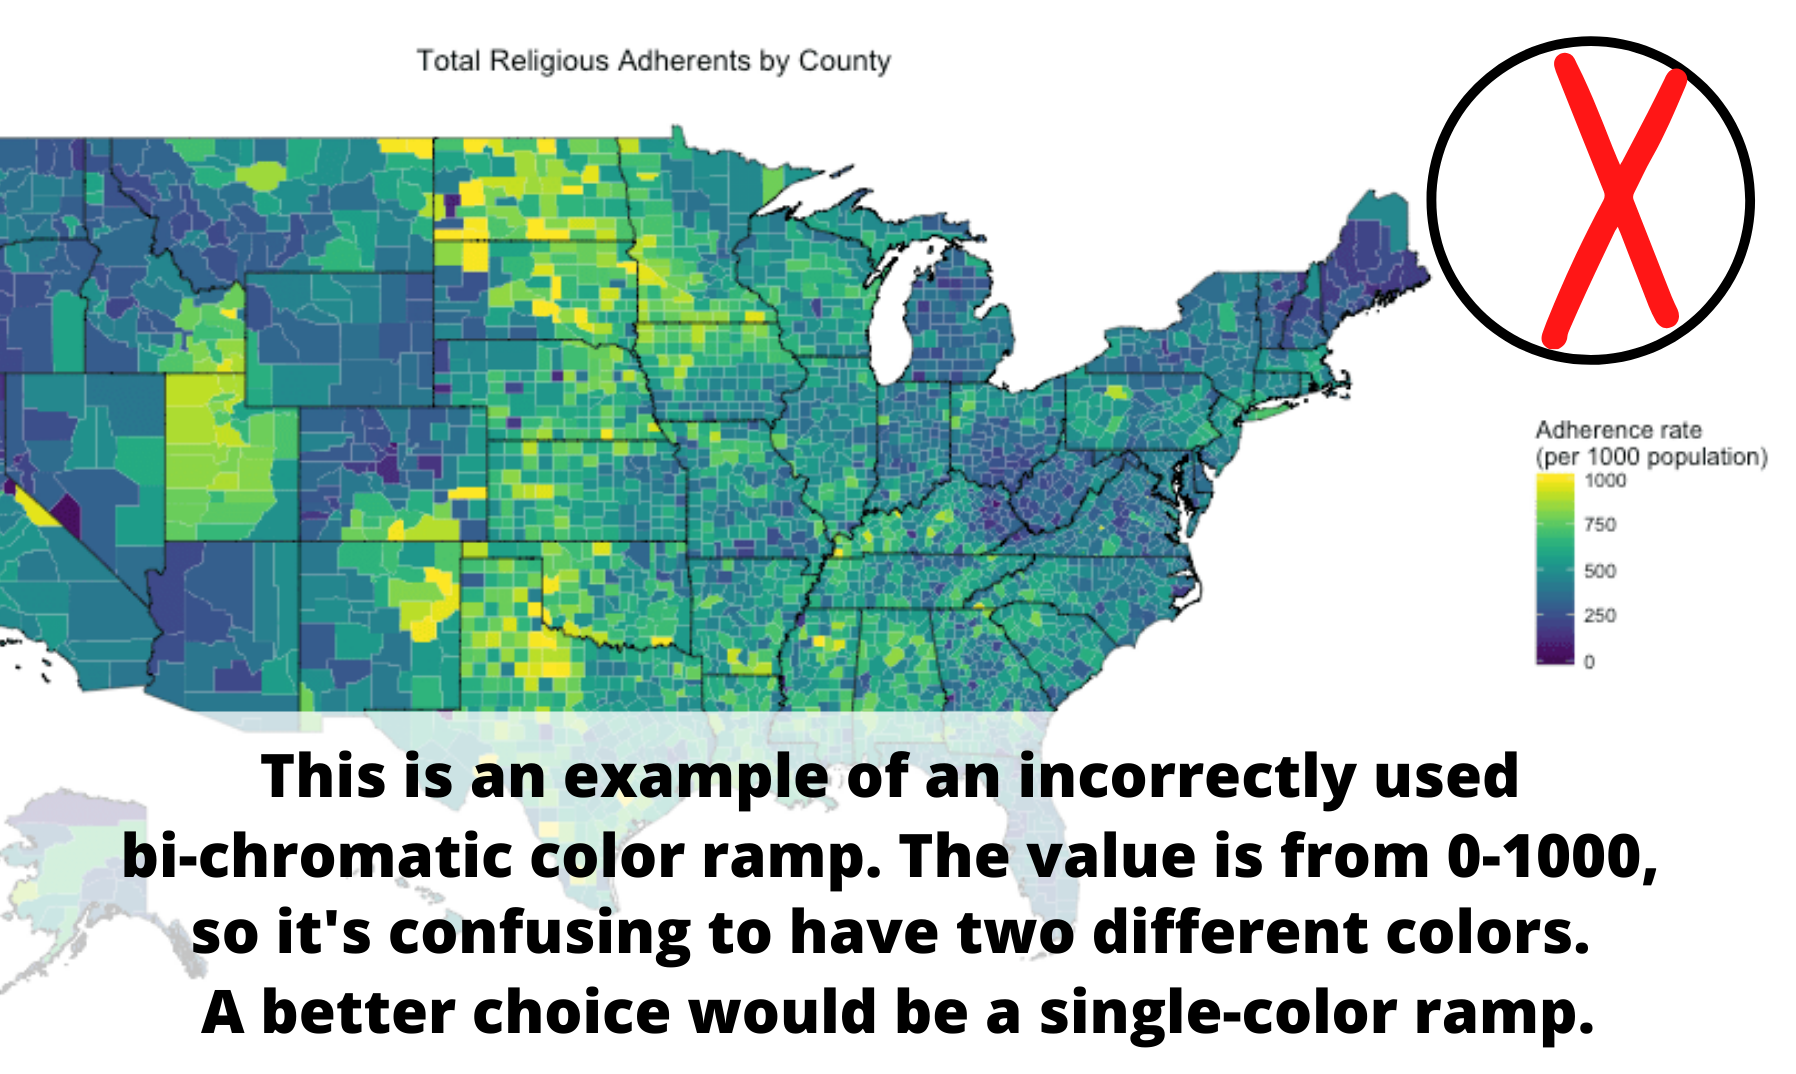
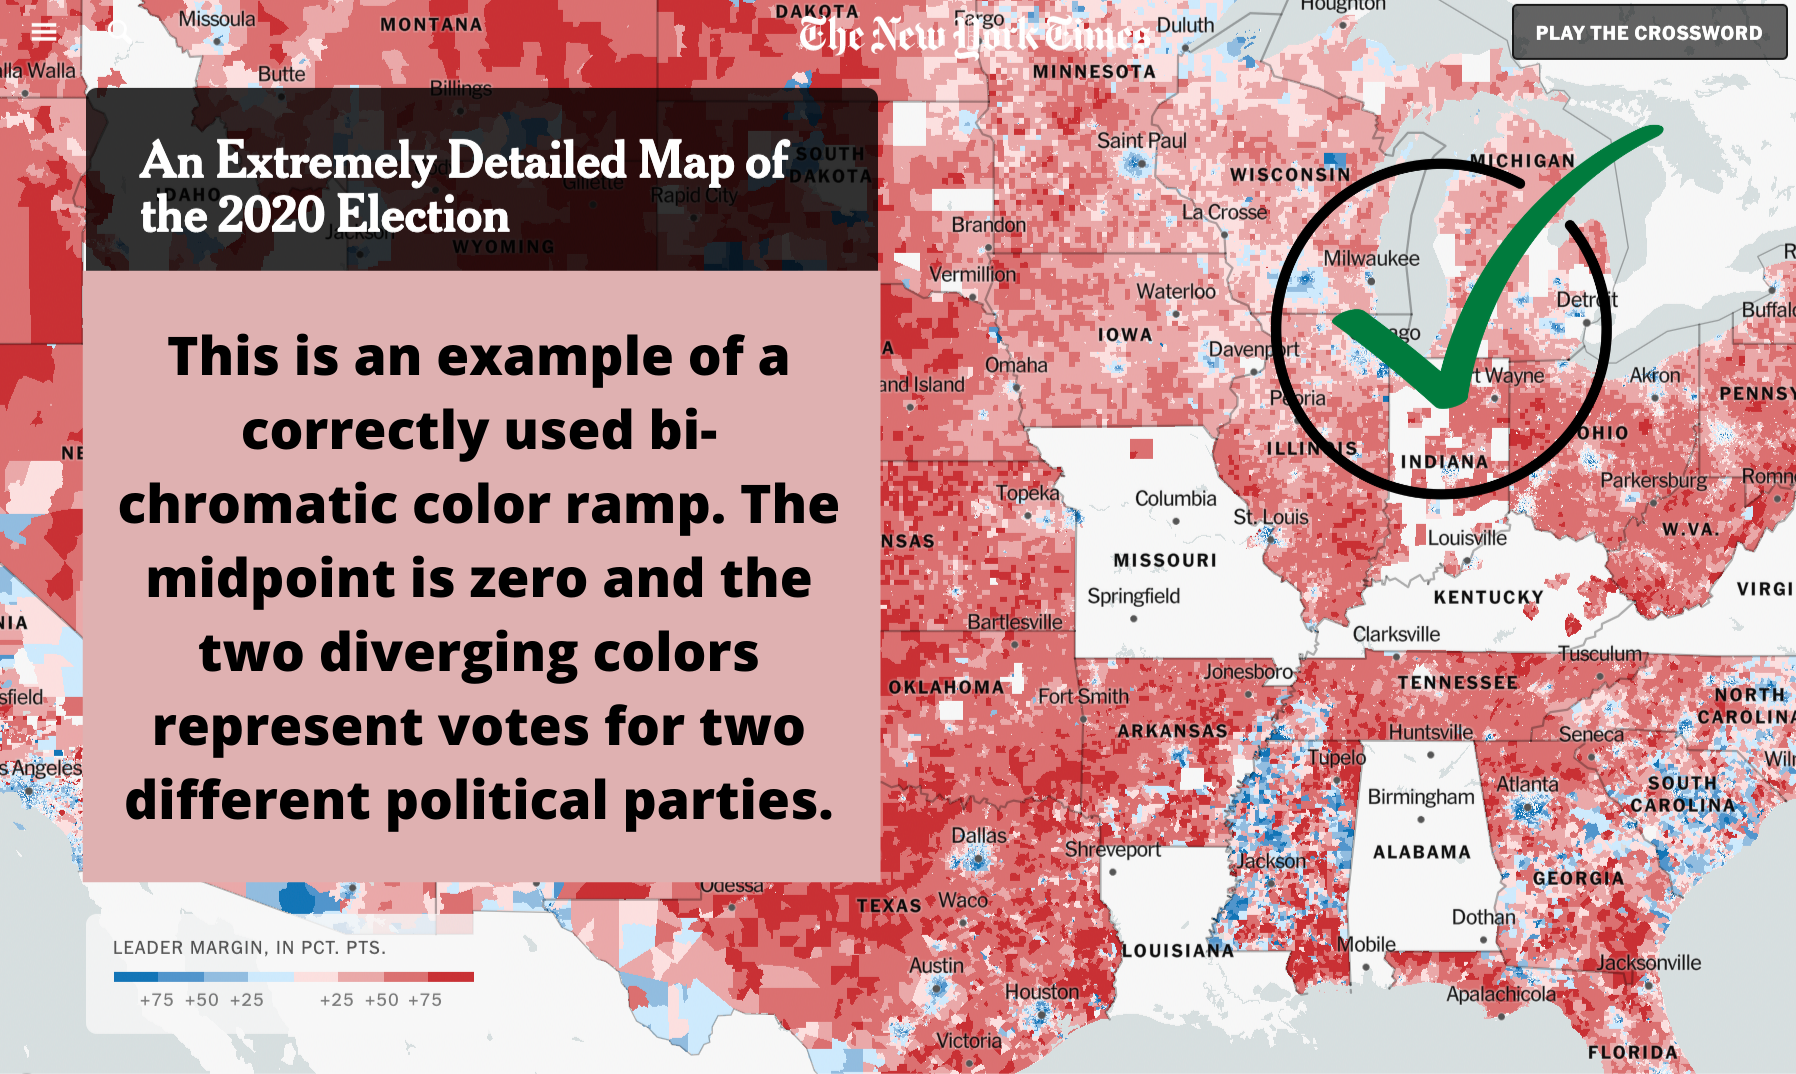
5. Choosing the wrong color ramp. A bi-chromatic color ramp (the one with two distinct colors) should be used with data that goes above and below a midpoint (e.g. above and below sea level). A single-color ramp should be used to display a continuum without a midpoint (e.g. percent of population fully vaccinated).
For more on this topic, check out these helpful resources on standard cartographic practices:
- Book: How to Lie with Maps by Mark Monmonier
- Book: Ways of Representing the World by Daniel Dorling and David Fairbairn
- Article: Which Color Scale to Use When Visualizing Data
Skipping Steps
Mapping takes time, so it’s tempting to skip steps to speed up the process. If you are using ArcGIS, maybe you skip over organizing your data in ArcCatalog. If you are using QGIS maybe you fail to document the plugins that you used. While speeding up the initial process, skipping steps can cause much more time wasted in the future. So be kind to your future self and avoid some of these common mistakes.
1. Not documenting the process. This can lead to a lot of confusion down the road if you have to recreate your map. Be sure to record where you got the data, how you cleaned the data, and your general workflow, including the spatial operations you performed and the settings.
2. Not taking the time to familiarize yourself with your data. Once a student told me that there was something wrong with QGIS because they had over 5000 rows in their map layer, but only a few hundred points showed up on the map. When we looked at the attribute table together, we discovered the cause of the confusion–the data was longitudinal. While at first glance it seemed that there were over 5000 addresses, there were only a few hundred unique addresses with data provided for several years.
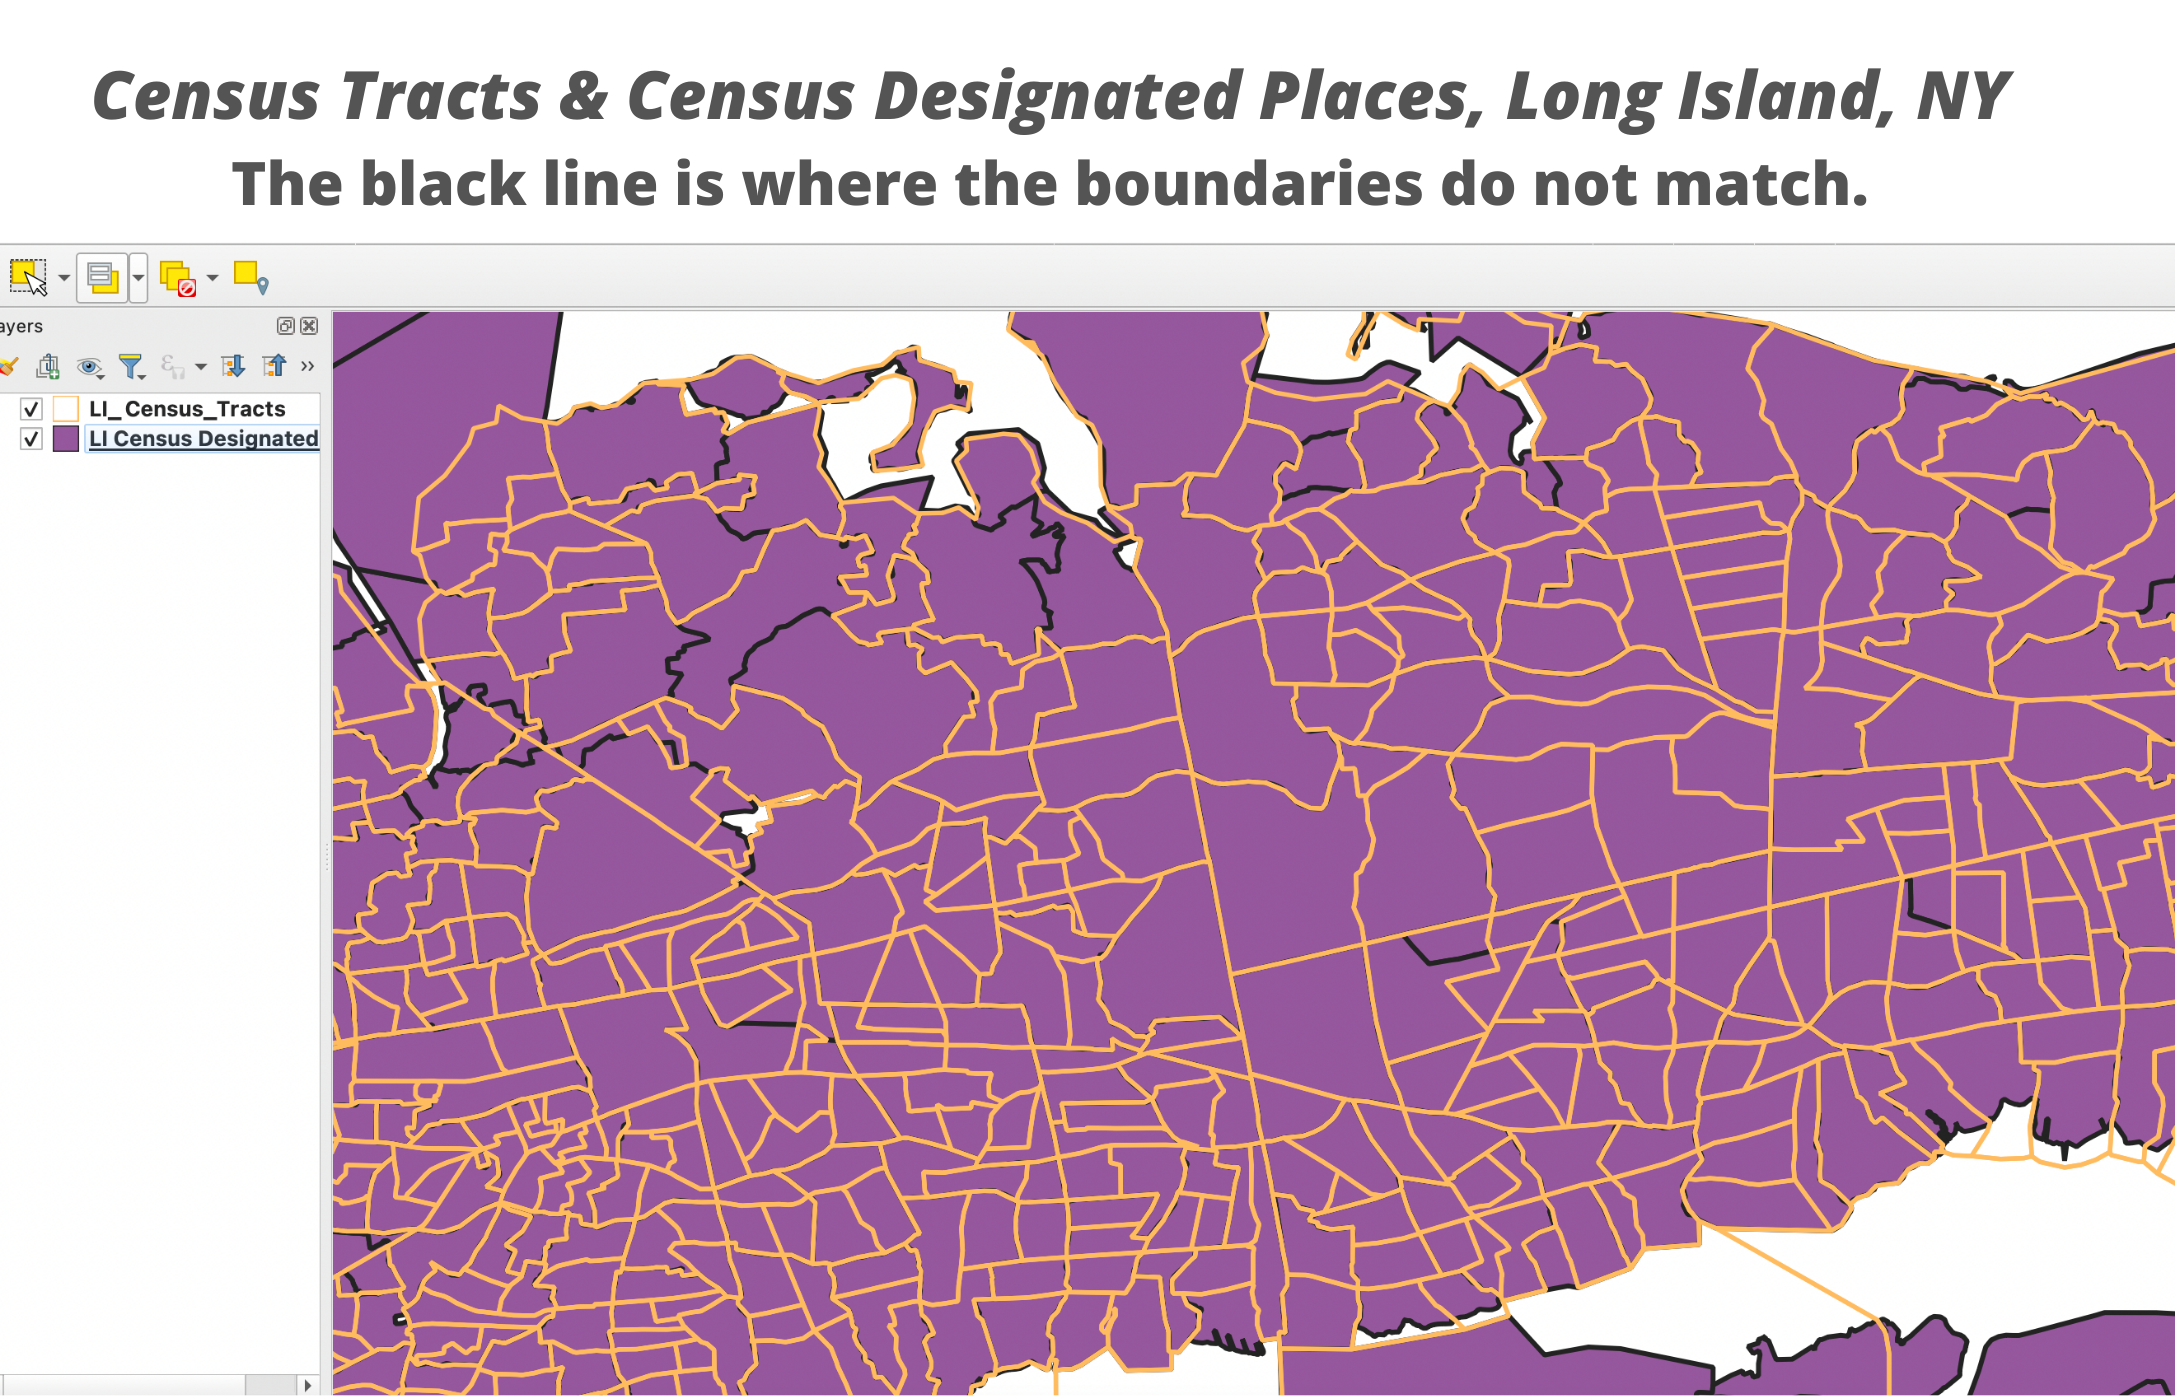
3. Not taking the time to select the best data available to you. I often see people using Census tract data when they are actually interested in a spatial phenomenon occurring at the neighborhood level. In this case, they should consider using neighborhood tabulation areas (for NYC), Census designated places (for some suburbs and rural areas), zip code tabulation areas (ZCTAs), or community tabulation areas (CTAs).
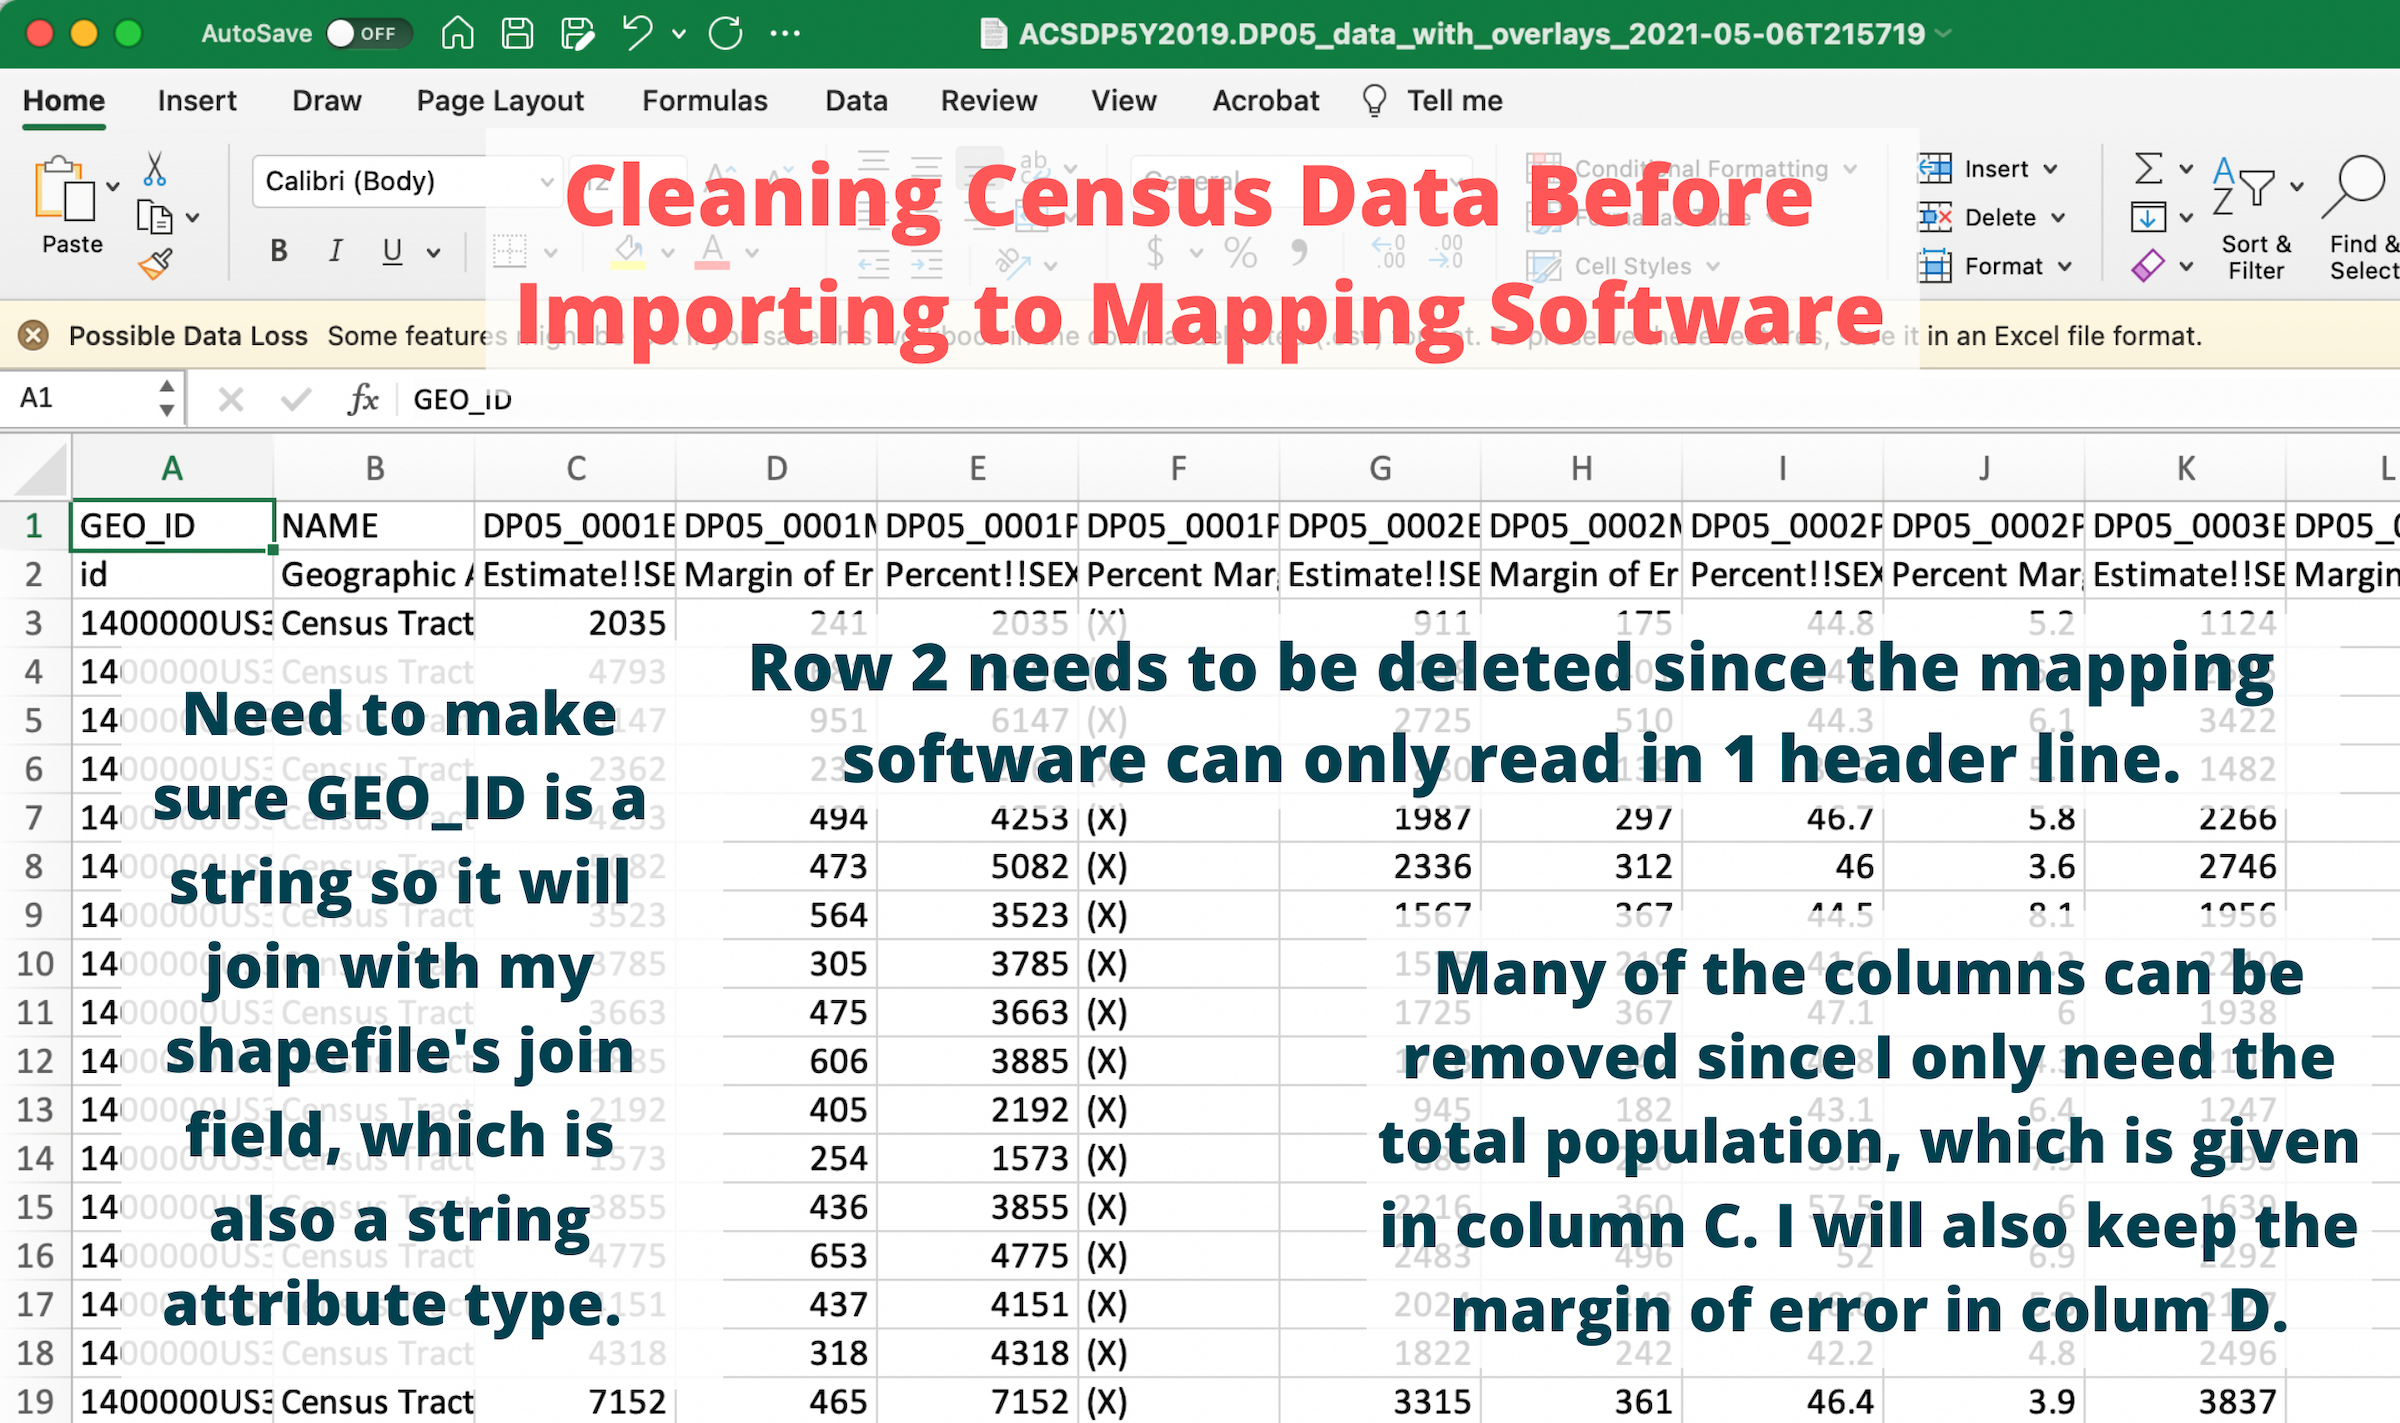
4. Not cleaning your data. Taking the extra steps to clean your data before you import it into your mapping software will help tremendously in the long run. For example, often we only need a few variables from a large dataset. The mapping process will be more manageable if you remove the unnecessary variables.
Being Uncritical
Maps are powerful. The cartesian map that divides the world into coordinates has its origins as a tool for nation-state building and colonialism. Due to this history, maps are often seen as authoritative and therefore representing objective truth. Still today, if something is displayed in the form of a map, it’s rarely questioned for its veracity. And yet, the real truth is that all maps only represent partial truths. For this reason, it’s essential to take the mapmaking process seriously and to approach it with a critical perspective.
Here are some common ways that being uncritical can negatively affect your map and affect how people engage with it:
1. Assuming that the default parameters for a tool are the most appropriate. While the GIS software is programmed to read and respond to certain aspects of your data, remember that you are the one who knows the data the best. If you let your mapping software make decisions for you, it could easily result in a map with compounded inaccuracies.
2. Not being aware of the geographic coordinate system and the projected coordinate system. A geographic coordinate system (GCS) tells the software where to draw the data and a projected coordinate system (PCS) tells it how to draw the data by flattening a 3D world onto a 2D surface. GCSs and PCSs work together and there are many to choose from. Each GCS is designed to fit a different part of the world and each PCS is designed to reduce different types of distortions. If you haphazardly combine them, your data may draw in the wrong place and your map may include unforeseen distortions. It’s important to decide which GCSs and PCSs you want to use and transform the map layers so they will be drawn without unknown errors. Check out this helpful article for more on how to select the right geographic transformation.
3.Thinking the map will speak for itself. Instead of treating your map as a representation of objective reality, try taking a feminist approach and be transparent about the subjective decisions that occur during the mapping process. This includes providing information about why the data was chosen, what important information is missing (the map’s silences), and how spatial operations manipulated the data.
4. Not knowing how the data was collected. Data collection is a tricky process that is also fraught with subjective decisions and human errors. Suppose you are not collecting the data yourself. In that case, it’s even more important to take the time to learn about your data sources and how they went about collecting, aggregating, manipulating and cleaning the data.
5. Not selecting an appropriate resolution for the data. Does the data’s resolution make sense in answering your research question? A lot of people use Census data, such as Census tracts, but sometimes these aren’t the most appropriate boundaries. For example, suppose you are studying a spatial phenomenon at the community level, do the boundaries that you’ve selected have meaning to those communities? Does it represent their sense of place?
6. Not fully understanding how the spatial operation works. Let’s say you need to aggregate data from the Census tract level to the Census Designated Place (CDP) level. You’d need to perform a Spatial Join by Location that compares the boundaries of both layers and aggregates the census tracts in each CDP. But how would the mapping software decide which Census tracts to include and which to leave out? If only a tiny bit of one Census tract is inside a CDP boundary should the whole tract be counted? Learning about how the Spatial Join by Location operation works is necessary to answer these critical questions.
Data Management
When people complain about things going haywire and “not working”, they are more often than not having data management issues. Much can go wrong when handling spatial data, from accidentally breaking up your shapefiles to having mismatches in your target and join fields.
Here is a list of some of the most common data management issues:
1. Not keeping your data organized. Although shapefiles are still the most widely used vector data format, handling them can be a pain. Each shapefile is not just one file but a set of files that must be kept together for the data visualization to work. Additionally, as you perform spatial joins and other operations, your number of files can quickly grow. To save yourself future headaches, be sure to establish a proper file management structure.
2. Giving your variables names that are too long, contain spaces, or have special characters. For shapefiles, there is a 10-character limit for attribute names. This can be a problem if you join a CSV that has attribute names longer than 10 characters. The names will be truncated, which could make them unreadable. Be sure to keep your attribute names short and without spaces or special characters since those can cause additional issues. Additionally, if using QGIS, note that the automatic join setting adds a prefix to each of the joined fields. The default prefix is the joint layer’s name, so if you have a long name, it will entirely cut off your field names, making them impossible to decipher.

3. Not getting the data into the correct format before importing it into your mapping software. Be careful if you edit a CSV dataset with Excel before importing it in your GIS software as Excel might automatically change long numbers into scientific notation. Once you save the CSV, those long numbers will be truncated. This is particularly problematic for US Census numeric ID numbers. Excel is also known for misformatting date fields. Be sure to check all of the attribute field types before importing the text file into your mapping software.
4. When performing a Join by Attribute the field type of the join and target fields don’t match. While seemingly small, this mistake will prevent a successful spatial join. There are a few ways to resolve this issue. One is to use a special tool in your mapping software to change the attribute type. In QGIS you can use the refactor field tool. Another option is to make sure that your mapping software reads in the CSV’s field types when you import the file. One way to do this is to create a .csvt file to indicate column data types in a CSV file.
5. Not setting up the “environmental settings” when working with raster data. I admittedly only work with vector data, but a member of the GIS Working Group provided this recommendation for raster users. They warned that not setting the mask, cell size, and snapping to option can cause significant problems. They recommended checking the environmental setting at the general and tool level before running any tool.
Moving Forward
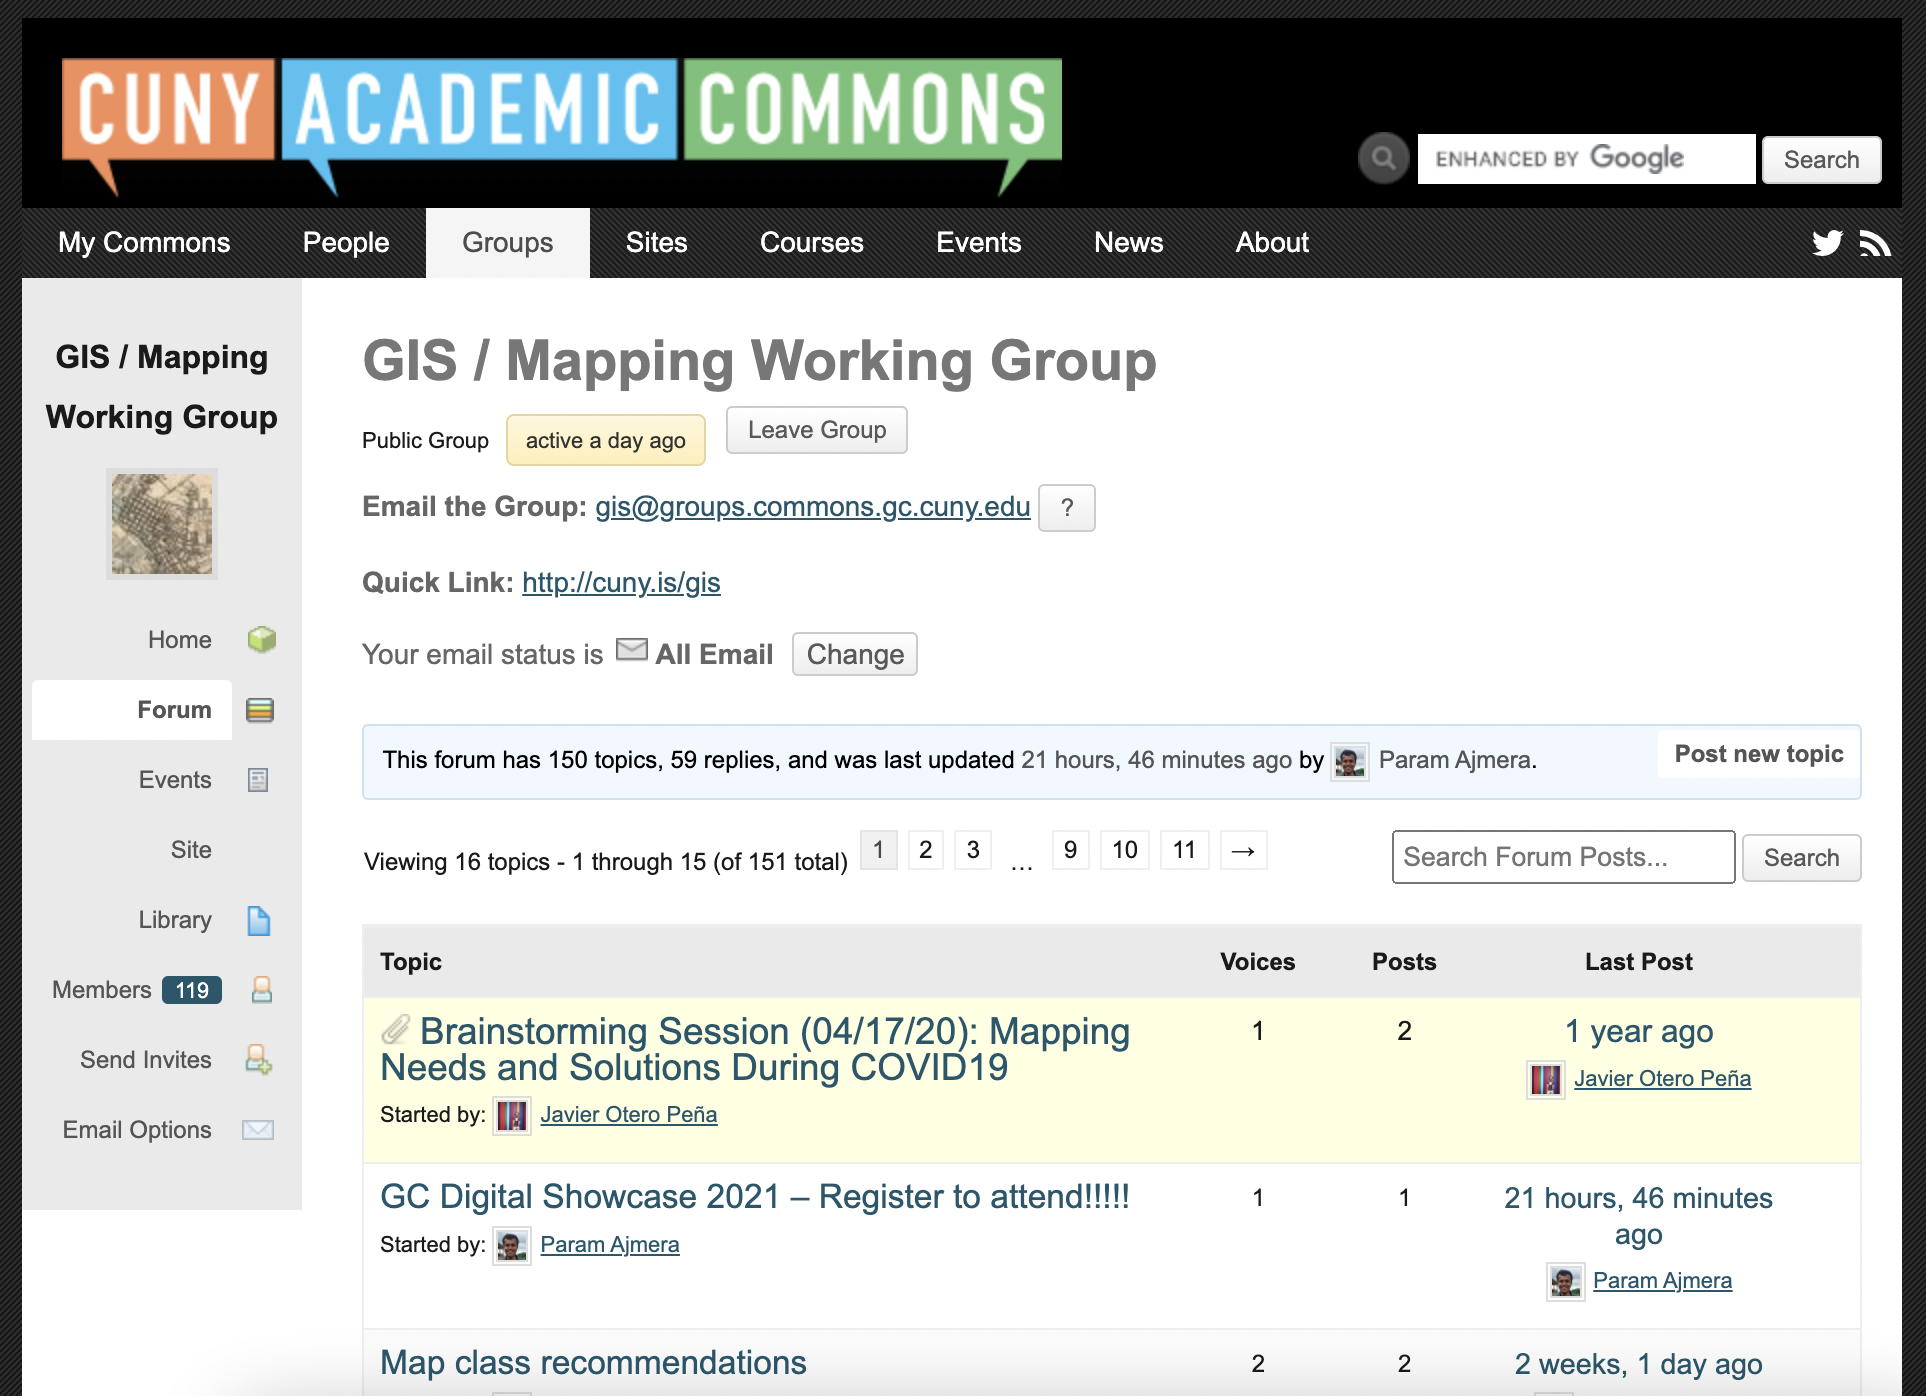
With this list of common mapping mistakes on hand, I hope you will save yourself some time and frustration. Also, remember that if you ever need assistance from a Graduate Center Digital Fellow, you can request a 30 minute consultation. Additionally, I hope you will join the Graduate Center’s GIS Working Group on CUNY Academic Commons where you can be part of a community of mapping practitioners and enthusiasts. All levels are welcome!

This entry is licensed under a Creative Commons Attribution-NonCommercial-ShareAlike 4.0 International license.

